🛒 Introduction
Initial meetings with real estate clients often involve a reality check around price expectations. For example, a buyer comes in expecting they can get much more for their money than is reasonable given the market. Alternatively, a seller assumes they can get a price much higher than is typical due to anecdotal evidence that the market is much hotter. Depending on the disconnect's severity, these meetings can be tense and time-consuming as they are less likely to end in a transaction.
Predicting the house price with the house features is a standard machine learning topic. And the neighborhood is usually an essential factor that influences the housing prices. However, neighborhoods are seldom arbitrarily defined. Sometimes there are neighborhoods within a broader neighborhood, and sometimes the neighborhoods consist of just a few blocks. What if we could estimate the geographic value of the house instead of labeling each house with a few pre-defined neighborhoods? Could this continuous feature improve the price prediction model? This project explores the housing sales data in Ames, IA. Various machine learning models were explored, and the final results were deployed in a preliminary interactive dashboard (R Shiny).
🖥️ Exploratory data analysis
Visualization of the neighborhoods
As seen in one of my previous projects, New York City: Booms and Blooms, neighborhoods bloom through a series of construction booms and development in the city/town. The age of the houses is first visualized in the image below. As the neighborhood name indicates, the Old Town neighborhood was the oldest in Ames. And then, new neighborhoods formed one-by-one around the Old Town and became the current Ames. The newest neighborhoods were near the town perimeter.
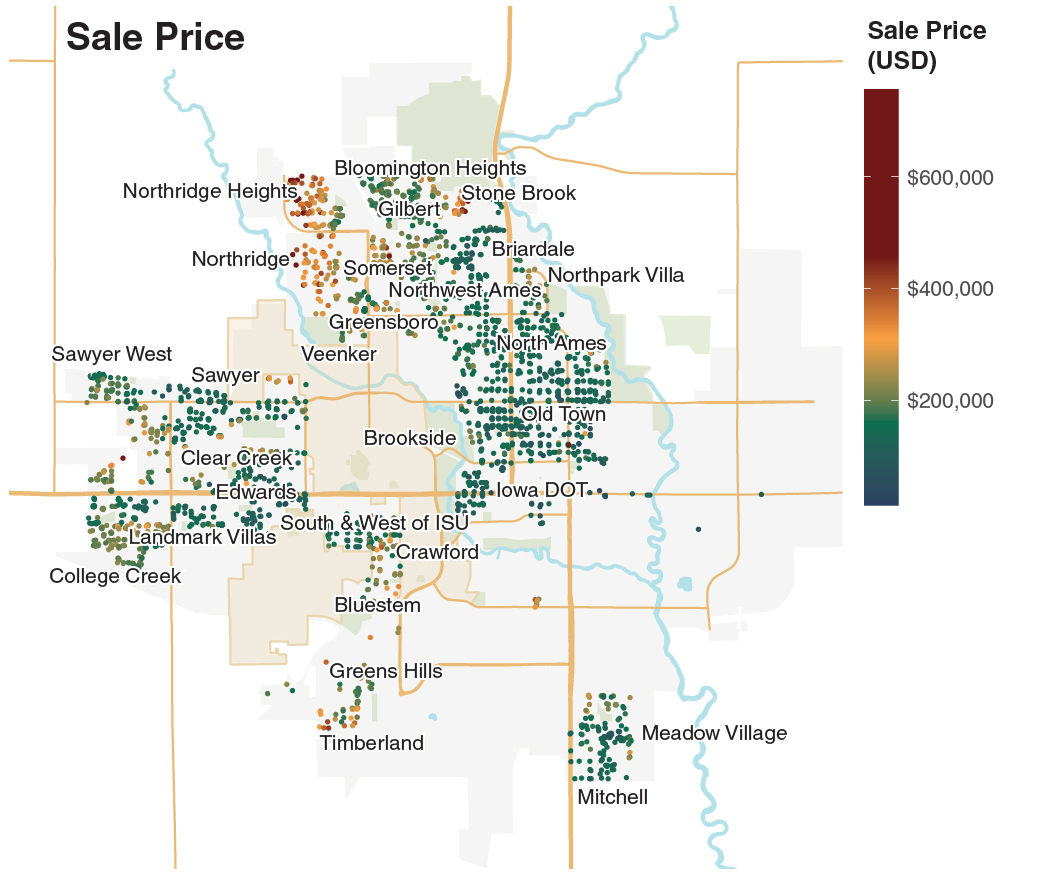
The second map shows the sale price for each house. As expected, most houses sold at high prices (> $400,000) are found in the newer neighborhoods. Significantly, the house sale prices in Northridge Heights and Northridge neighborhoods were more than 2x the price of the median house sale price (~$160,000).

Most of the houses in Ames are single-family houses. And the median house sales price was around $160,000 from 2006-2010. The price is then plotted against the square footage of the living area. There is a high correlation between the housing price and the area, as shown with a regression line (blue).

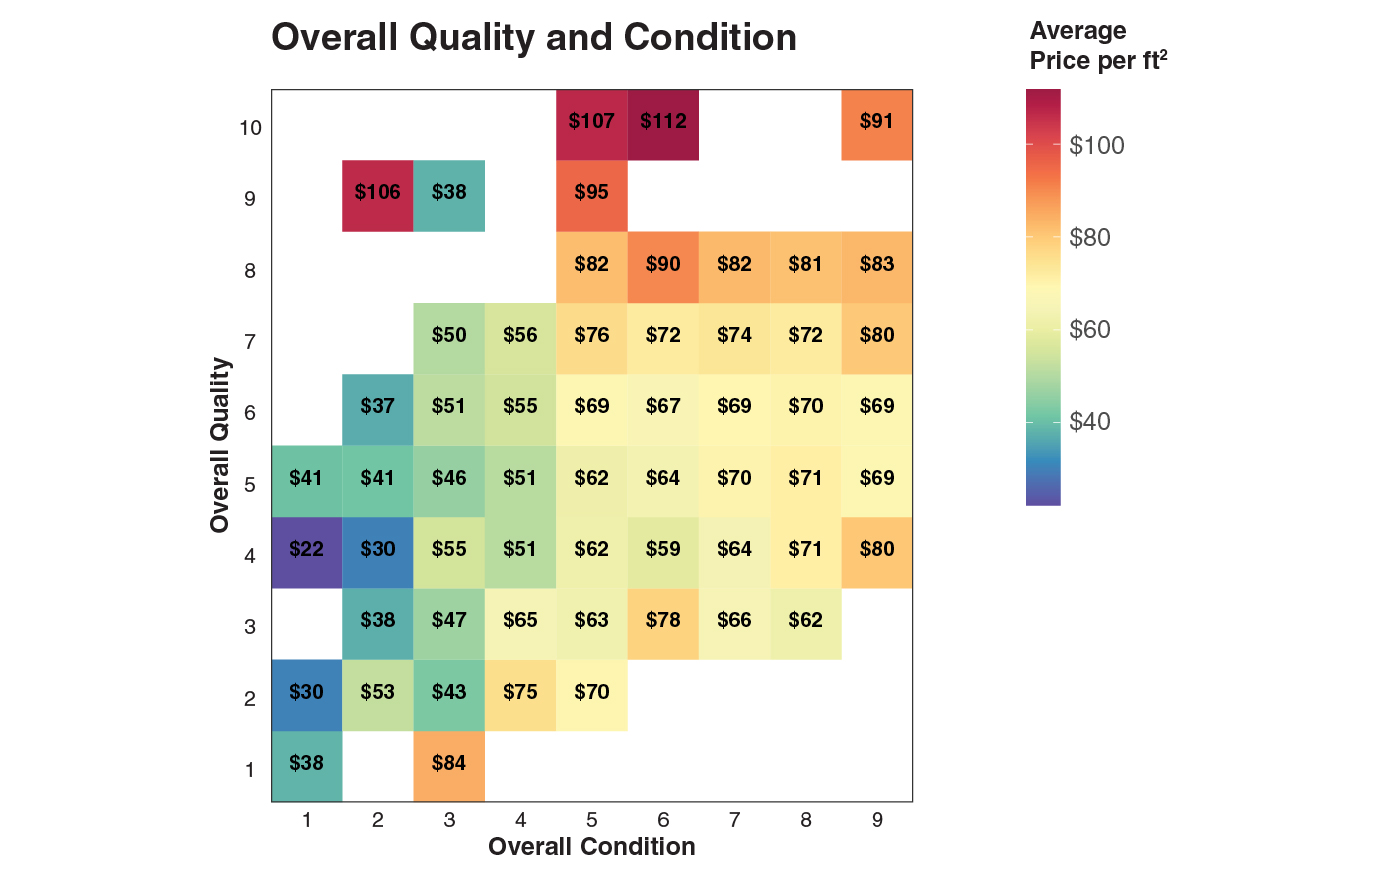
For a fair comparison among houses, we can divide the sales price by the area to obtain the price per ft2. Two of the most controlling factors of the housing price were the overall quality and condition of the houses and the average price per ft2. As expected, houses with high quality and in good condition were valued more.
👨🔧 Feature engineering
The neighborhood was labeled inconsistently, and the sizes of the neighborhoods (i.e., the number of houses in each neighborhood) varied. Some neighborhoods had less than ten sales data, which could result in overfitting. Instead of using a categorical feature, we engineered a new numerical feature related to the geographic value. The geographic value is determined after the model is trained.
The geographic value indicates the value added to the house for being at that location. The same house with the same features will have a higher price if the geographical value is high. Using this feature, we can estimate the house price without labeling it in a specific neighborhood. Interestingly, the geographic value correlated with the crime rate – regions with higher crime rates have lower geographic values.


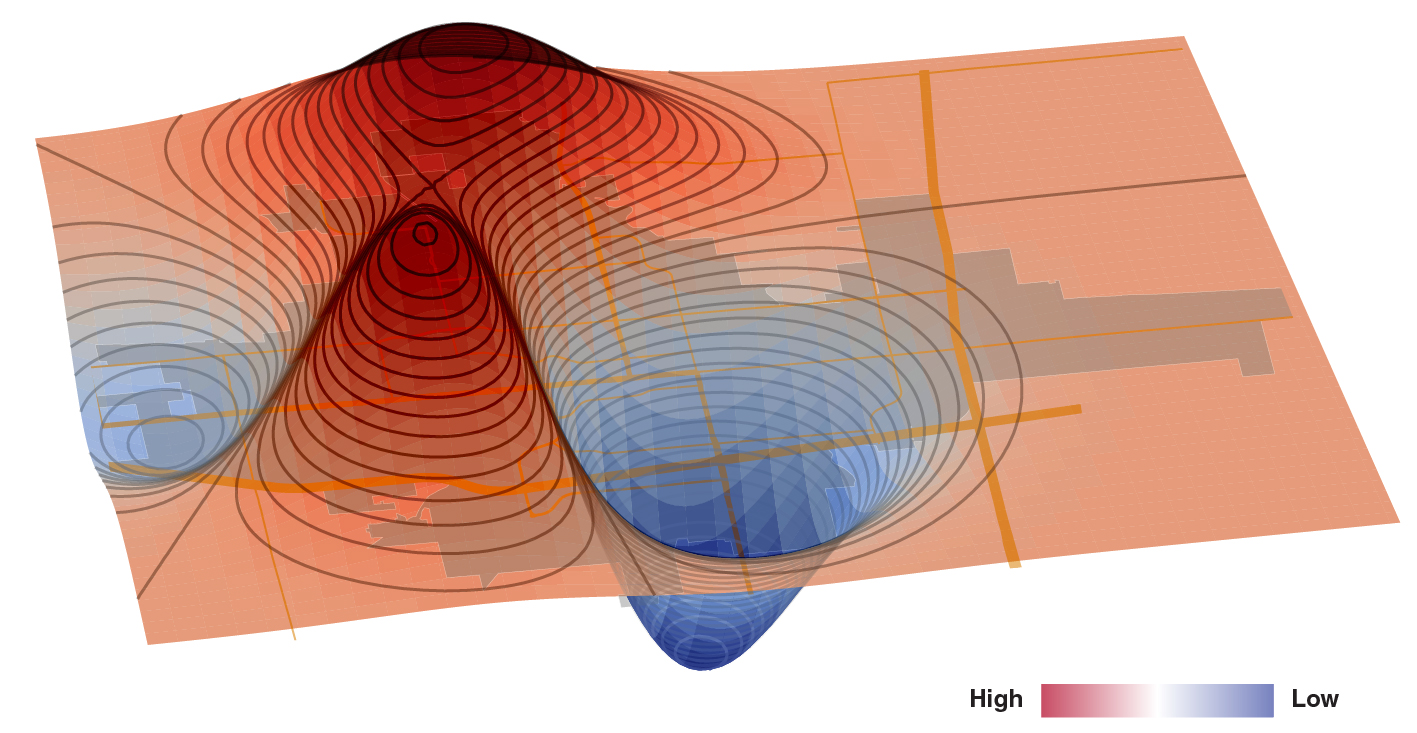
We can also visualize the geographic value in 3D, where the height of the surface corresponds to the geographic value (see below).
One of the notable locations is the Iowa State University Campus town (the peak at the front).
The houses around this area has a higher value since Ames is a college town.
🦾 Machine Learning Algorithms
Initially, the data frame included 145 features (including the one-hot encoded and engineered features), which were reduced to 45 features through exploratory data analysis, and finally, the features were reduced to 32 using Lasso Regression. The data were split into the train (70%) and test (30%) datasets.
Multiple Linear Regression
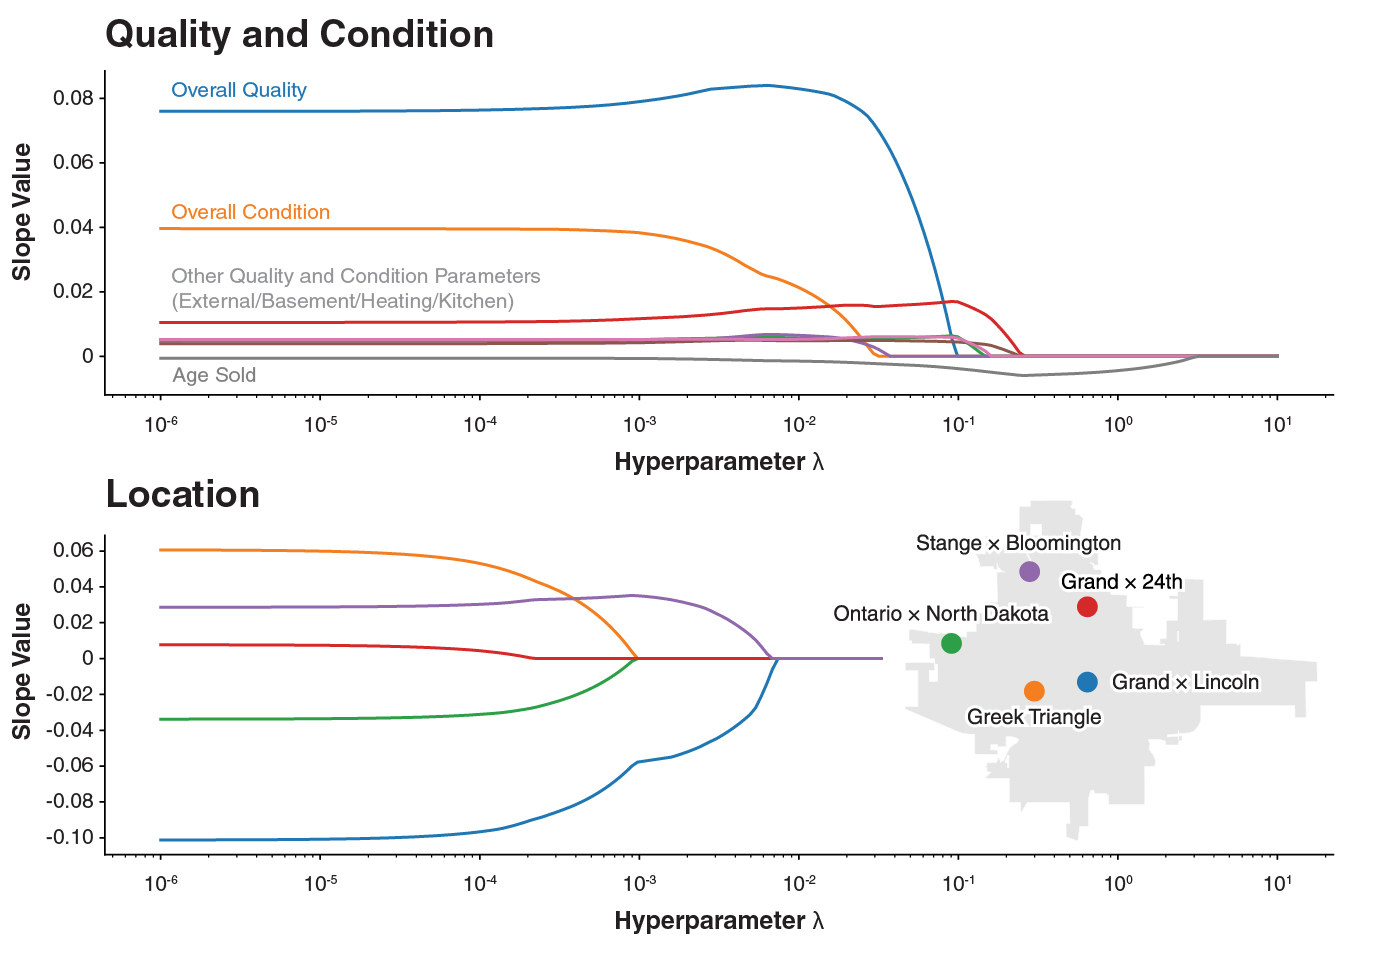
First, the Lasso Regression model was used to eliminate insignificant features. The graph below shows the coefficients of some variables with different lambda values (log-scale). The features that "survive" longer up to a high lambda value have a more significant contribution (either positive or negative) to the price. For example, the quality and condition significantly impact the house price.
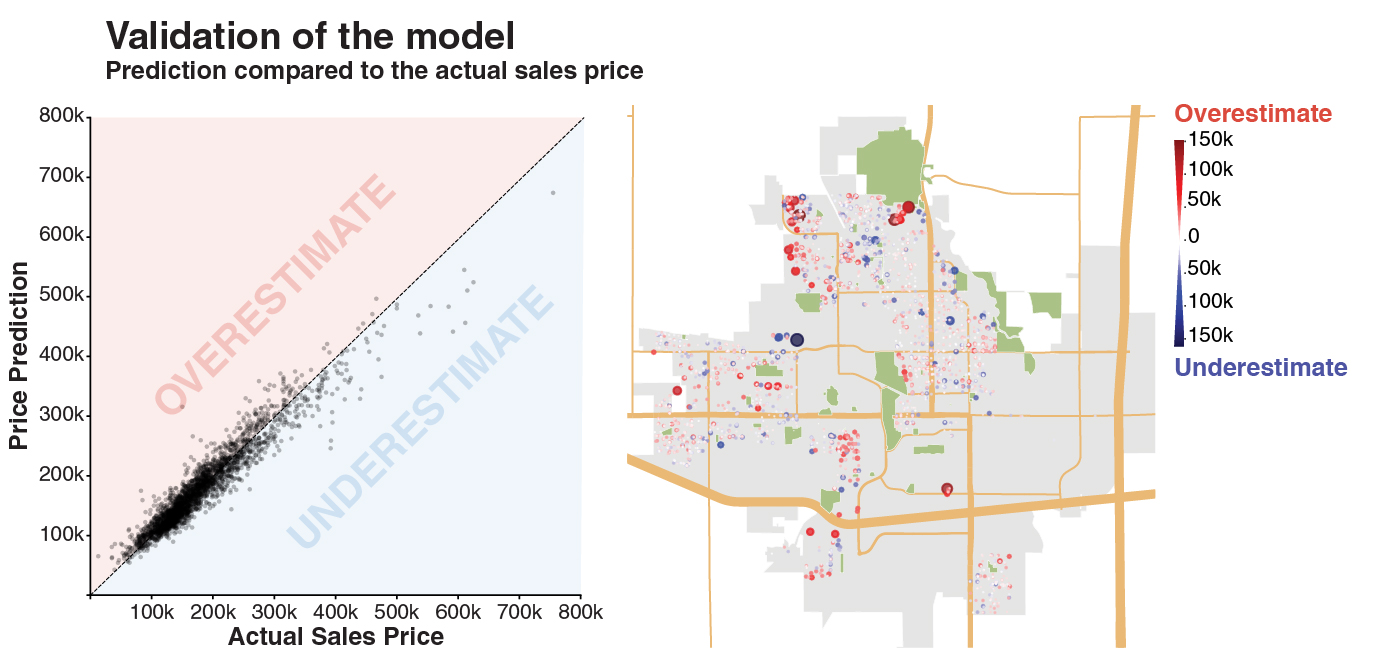
Then, the Ridge regression model was trained. Grid search with cross-validation (3 folds) identified lambda of 0.0032 as the best for the Ridge model and returned an R2 of 0.900. The figures below show how the prediction compares to the actual sales price. And the residual map shows which house the pricing model is overestimating (red) and underestimating (blue).
Other ML methods
Other machine learning methods were also tested. The test results with the best parameters are summarized in the table below.
| Method | Best R2 score | Hyperparameters |
|---|---|---|
| Lasso Regression | 0.900 |
|
| Ridge Regression | 0.900 |
|
| SVR | 0.918 |
|
| Random Forest | 0.899 |
|
| Boosting | 0.922 |
|
| XG Boosting | 0.923 |
|
📱 Shiny App
This app is best viewed on large screens
📝 Conclusion
- While many factors affect house prices, square footage, overall quality, and condition are consistently shown as essential features.
- We successfully predicted house prices with ML models achieving R2 scores from 0.90 to 0.92.
- We have created a framework for estimating the geographical value based on historic data and machine learning techniques.
- Implemented various ML approaches with new features, improving the initial linear regression model.
- We developed an interactive web-based application that allows users to explore house prices and generate predictions.
This project is developed by Chad Loh, James Reno, Michelle Bui, and Alex Galczak
Data Source
- Ames, IA housing sales data : The Ames Housing dataset was compiled by Dean De Cock for use in data science education