🗽 Introduction
New York, New York
The Big Apple, the city that never sleeps, Empire city, the Capital of the World, the Center of the Universe, and the city of dreams… New York is one of the most famous, popular, and populated cities globally.
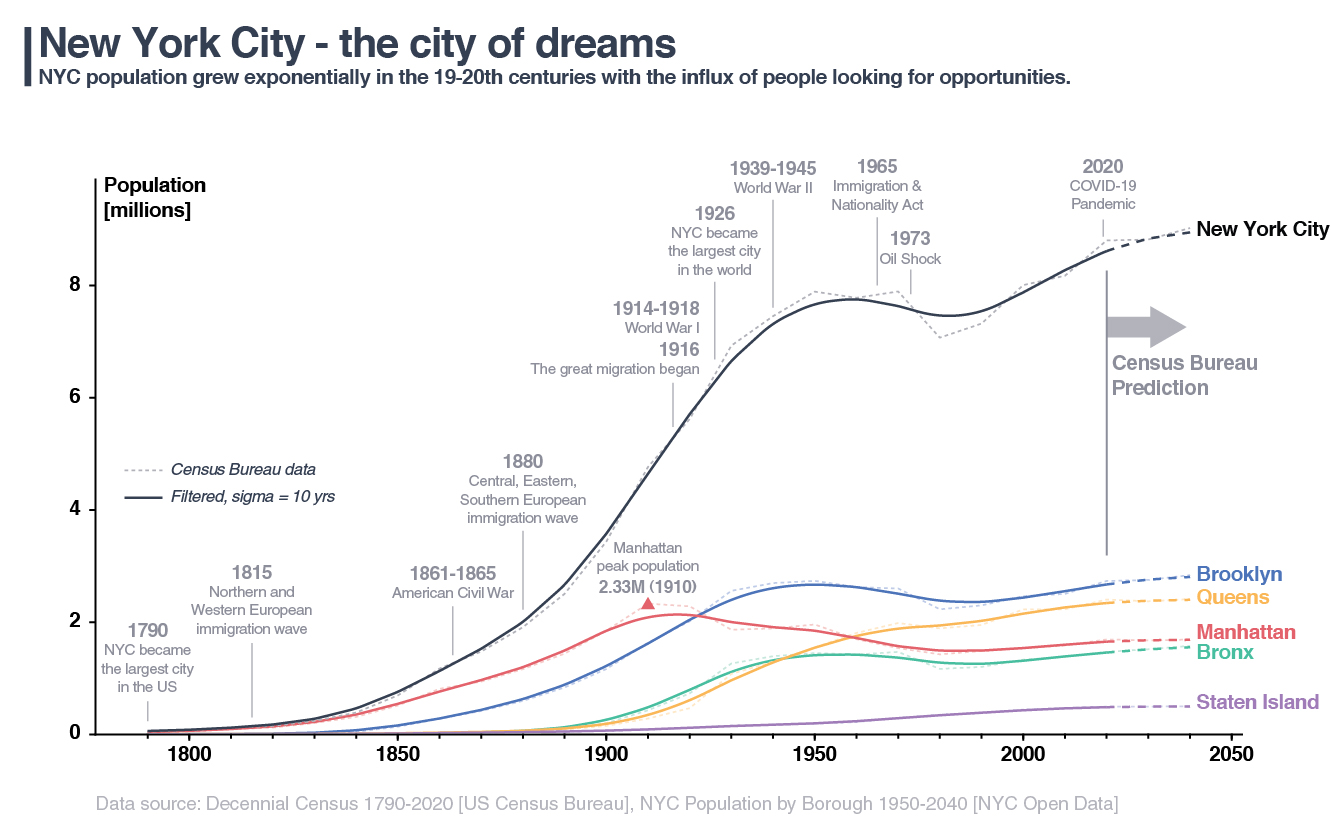
The population of NYC grew exponentially in the 19th Century due to the massive influx of immigrants pursuing the American Dream. The graph below shows the NYC population since 1790 when the US Census started. As annotated on the population graph below, there were multiple immigration waves from different regions throughout the history of NYC: the immigration from Northern and Western Europe in the 1810s, from Central, Eastern, and Southern Europe in the 1880s, from the Southern states during the great migration in the 1920s, and finally from Asia and Latin America after the Immigration and Nationality Act of 1965 was signed into law. The 2020 Census showed that 629,000 people moved into the city in the past 10 years, about a 7.7% increase from 2010. Currently, New York has the highest population density of any major city in the United States, with over 27,000 people per square mile.
The population of each borough is also shown in different colors. Manhattan's population rapidly increased in the 19th century, reaching 2.33 million people in 1910, almost 40% more than the current population. In the 20th century, the population in other boroughs rapidly increased, and Brooklyn and Queens even exceeded Manhattan's in 1930 and 1960, respectively.
Population growth is a good indicator of a thriving city. Can we visualize how the city expanded throughout history using data science? How did different neighborhoods and communities bloom? And can we identify the characteristics of the areas depending on when and how they were developed?
Buildings of New York City
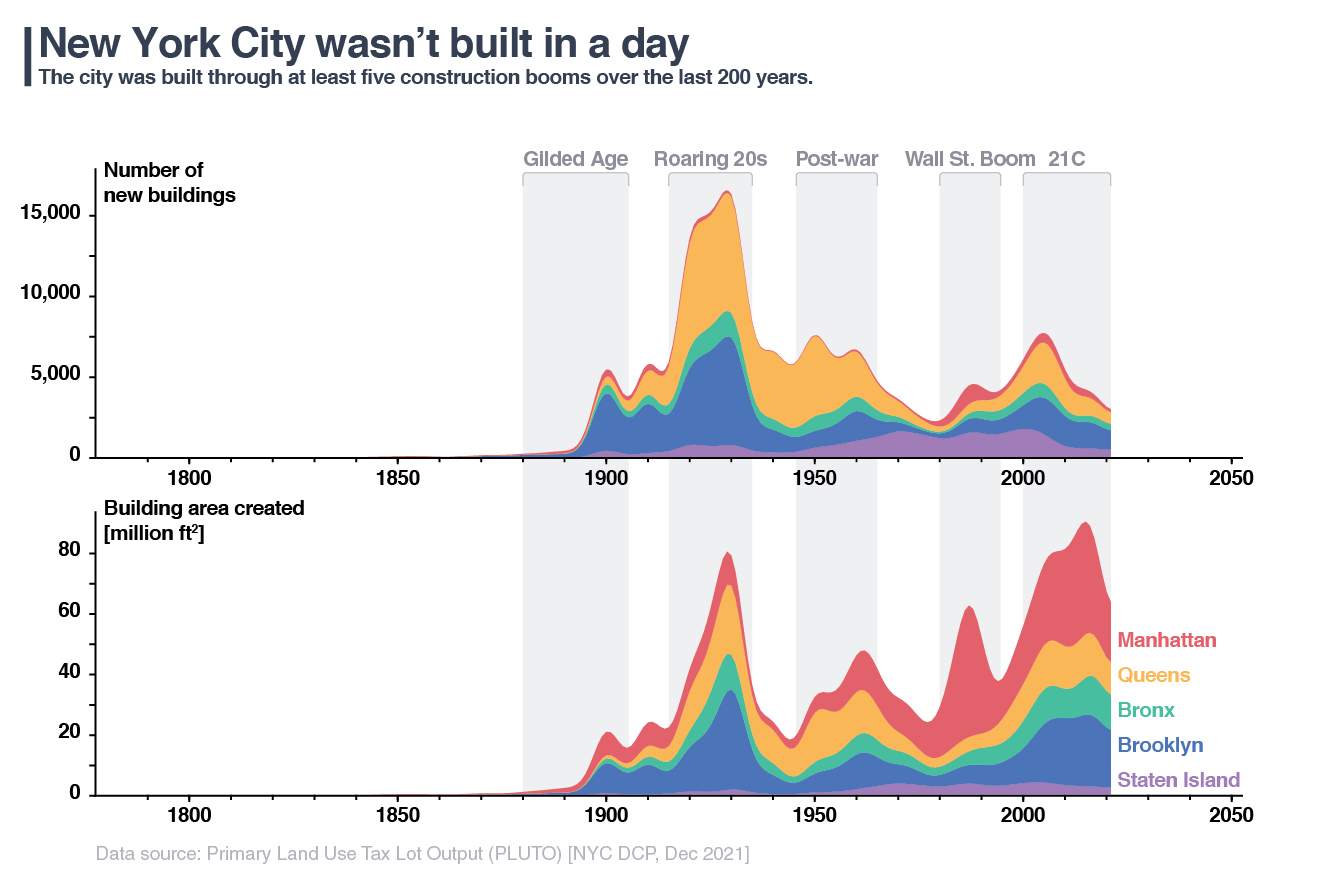
Like Rome or any other city, NYC wasn't built in a day. The construction or building data could contain great insights into how the city developed since construction is a straightforward indicator of urban development. NYC Department of City Planning has a dataset of all currently existing buildings in the city (800,000+ buildings). The graph below is a stacked area chart showing the number of buildings built each year (top) and the total building area created each year (bottom). Note that this data only includes currently existing buildings, so it underestimates the older years.
Unsurprisingly, the construction industry had its ups and downs throughout history. Five construction booms were identifiable from these graphs: the Gilded Age (1880-1905), the Roaring 20s (1915-1935), the Post-war era (1945-1965), the Wall Street Boom (1980-1995), and the 21st Century (2000-Current). The construction projects were also not always equally distributed in the five boroughs. The center of development shifted during each construction boom, and new neighborhoods and communities bloomed in each boom. As the title of this article indicates, this project focuses on these booms and blooms.
🏗️ The Five Booms
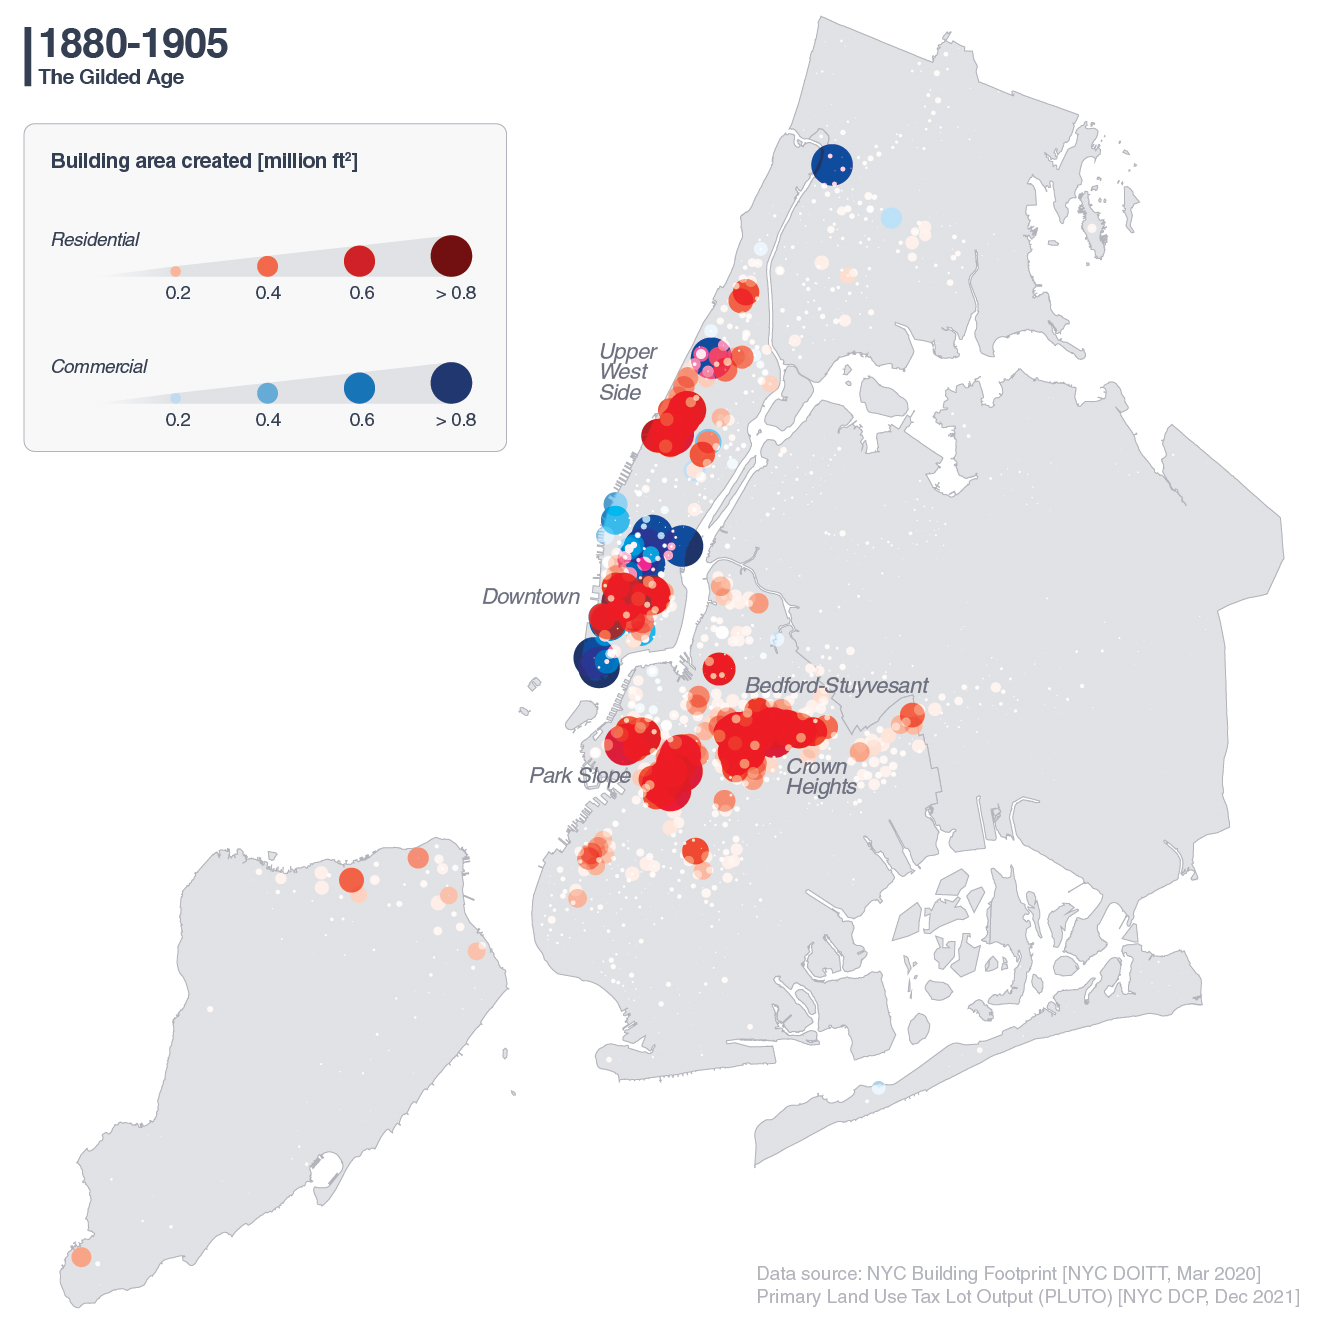
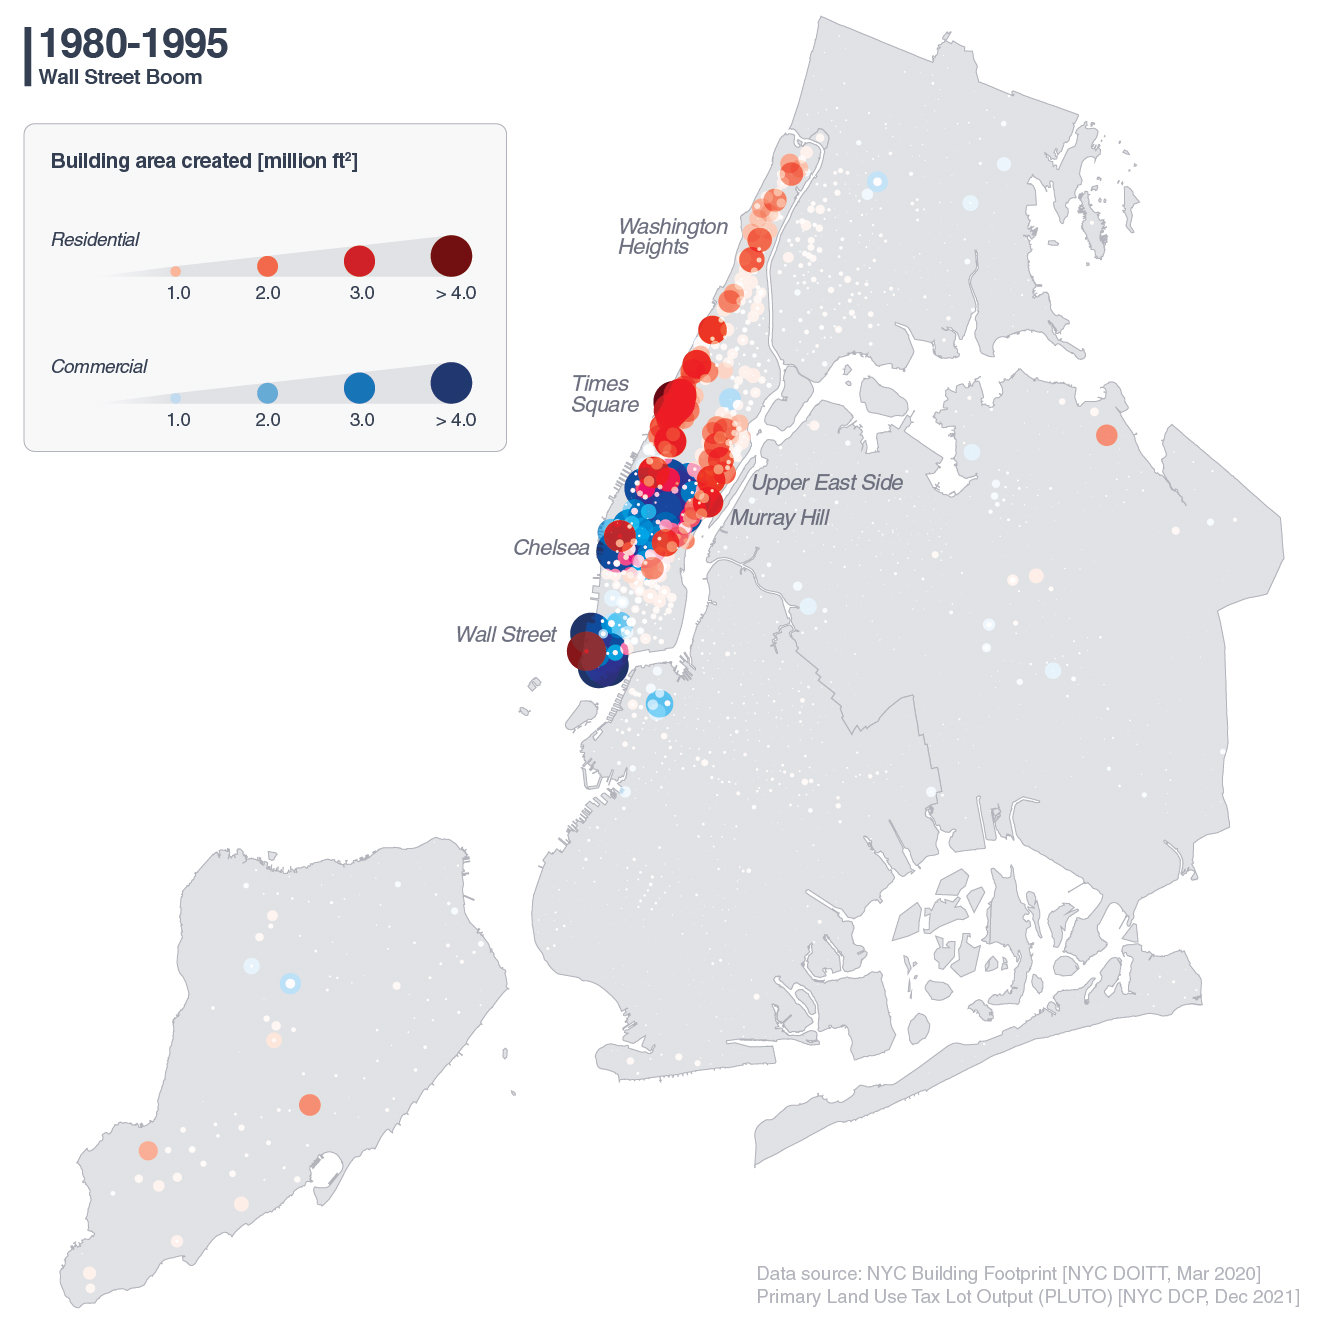
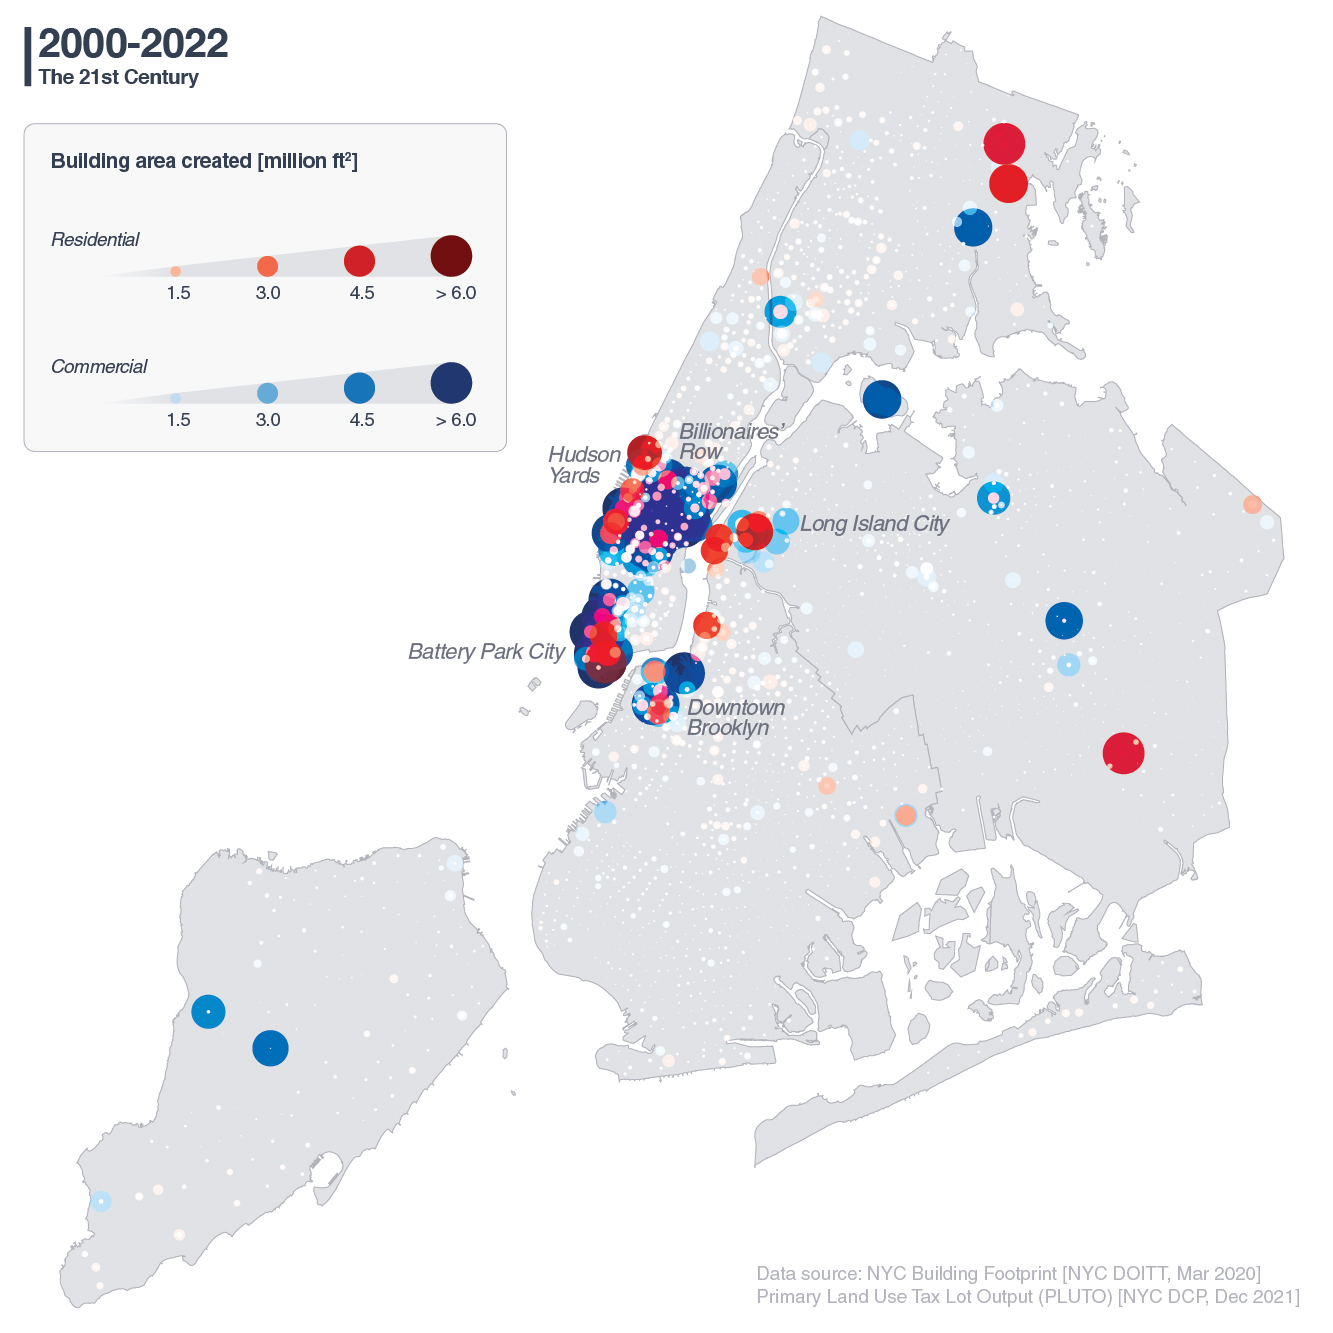
The five construction booms are visualized with bubble maps. The size of each bubble represents the sum of the new building area created in each census tract. The red bubbles represent residential buildings, and the blue bubbles represent commercial buildings.
The Gilded Age (1880-1905)
The first construction boom was in the 1880s, the Gilded Age. Luxurious mansions were built along 5th Avenue, and large development projects were undergoing in Downtown Manhattan and Downtown Brooklyn. It was still in the early stage of the city's history, and therefore, the development was centralized in only a few areas near the central business districts. The new buildings in Brooklyn were mostly residential, while the buildings in Manhattan were both residential and commercial.
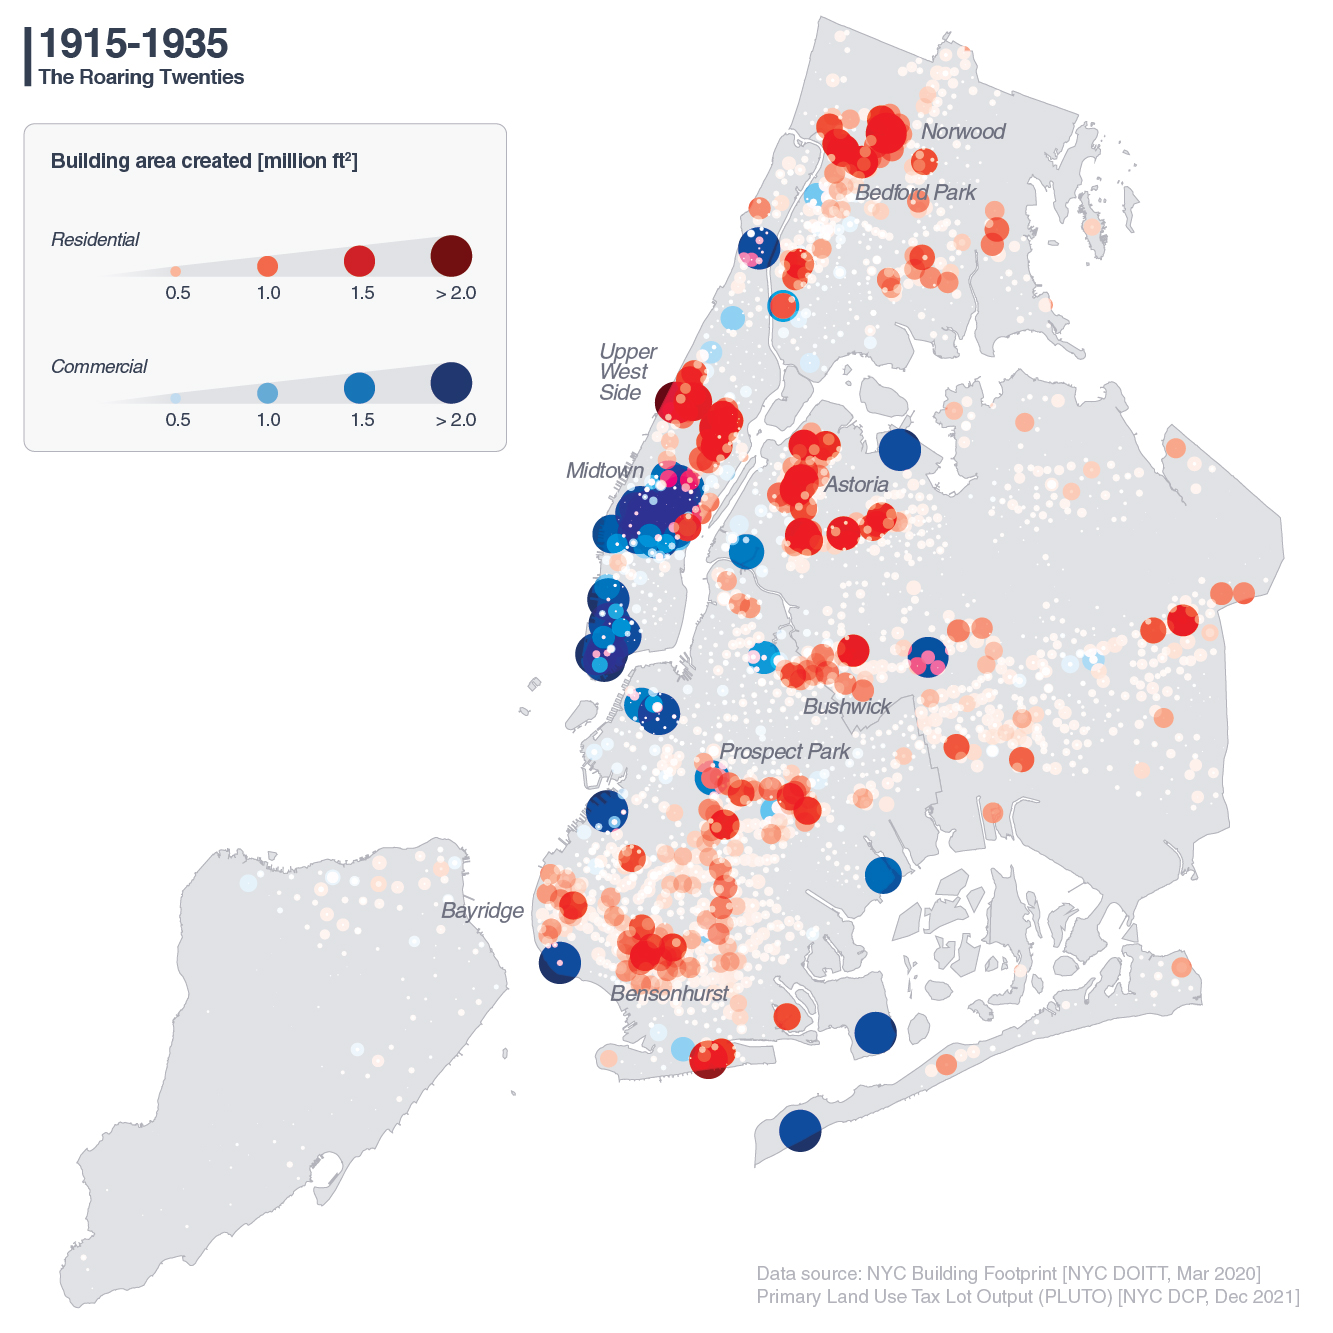
The Roaring Twenties (1915-1935)
The second construction boom was during the Roaring Twenties. After the subway lines connecting Manhattan to Queens, Brooklyn, and the Bronx were constructed, more buildings were built in the suburban areas that were now easily accessible by subways. These new neighborhoods like Astoria, Bushwick, Prospect Park, Bensonhurst, Bayridge, Norwood, and Bedford Park are all residential suburban neighborhoods. The bubble map shows a clear urban sprawl pattern, and the development of these suburban neighborhoods and communities decentralized the city.
Another neighborhood that developed in this era is Midtown, Manhattan. Many commercial buildings were constructed, including some of the most iconic buildings like the Chrysler Building (1930), Empire State Building (1931), and 30 Rock (1933).
Post-war (1945-1965)
The third construction boom was after World War II. More projects were developed in the further suburbs, and the urban sprawl reached the city's perimeter. More residential neighborhoods bloomed, such as Flushing, Fresh Meadows, Forest Hills, Jamaica, Ozone Park in Queens, and Coney Island in Brooklyn. This meant that the city had saturated and that there was no more easily accessible land to expand the city, at least within the city perimeter. It should be noted that Staten Island is not included in this analysis because it is geologically isolated, and the Verrazzano bridge connecting Staten Island and Brooklyn was only completed in 1964.

Wall Street Boom (1980-1995)
The fourth construction boom was in the late 20th Century when Wall Street was booming. It was also the time when gentrification started in various parts of the city. As there was no easily accessible land to develop in other boroughs, the center of construction returned to Manhattan. As the interest in Wall Street was heightened, construction in the Financial District (Wall Street) also increased. Other areas that have developed during this time are Times Square, Washington Heightes, Murray Hill, and the Upper East Side.
The 21st Century (2000-2022)
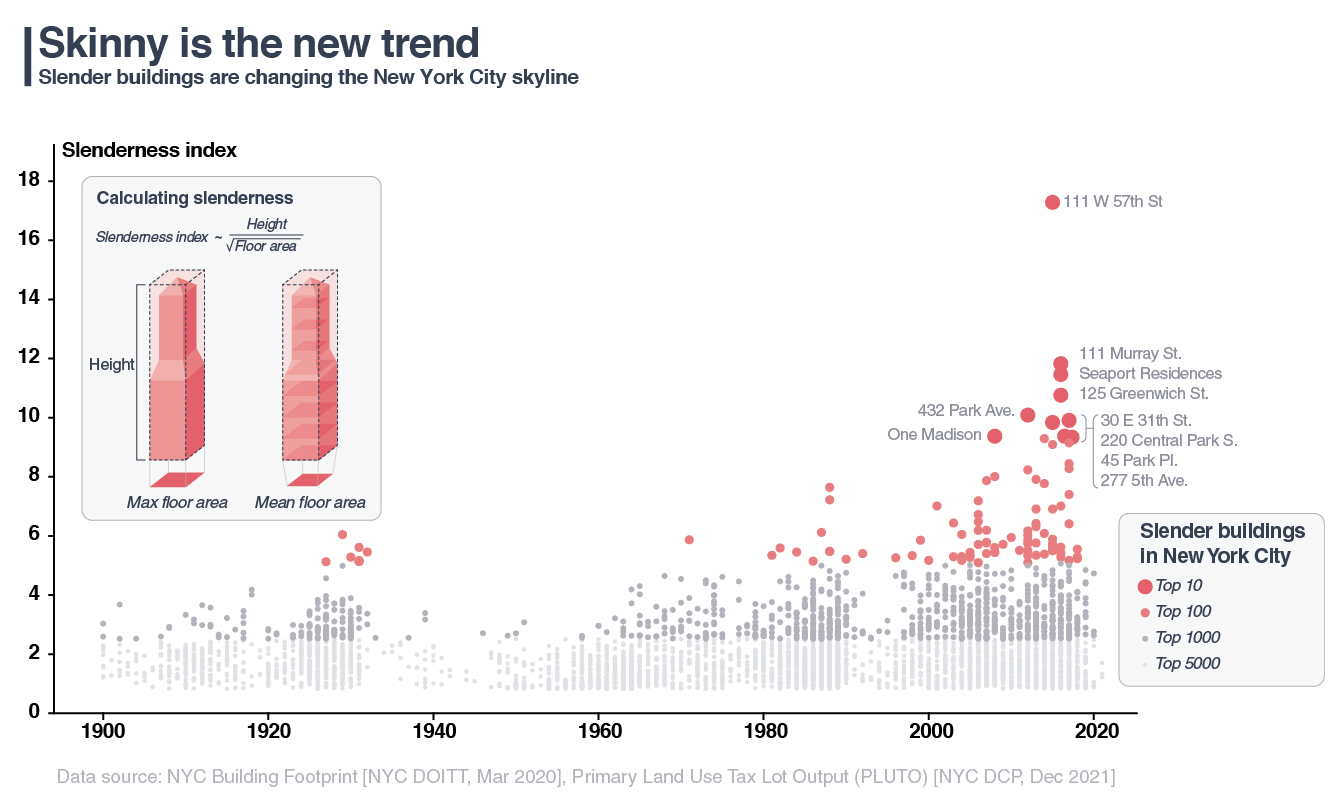
The fifth construction boom is the current construction boom in the 21st Century. New neighborhoods with skyscrapers are being developed inside or near Manhattan, such as Hudson Yards, Long Island City, Billionaires' Row, Downtown Brooklyn, and Battery Park City. This 'recentralizing' phenomenon is due to the high property values in Manhattan as well as the advances in construction technology. To fit these buildings into a limited space, many of the new buildings are not only tall but also skinny. The slenderness of the buildings is further analyzed and visualized next.
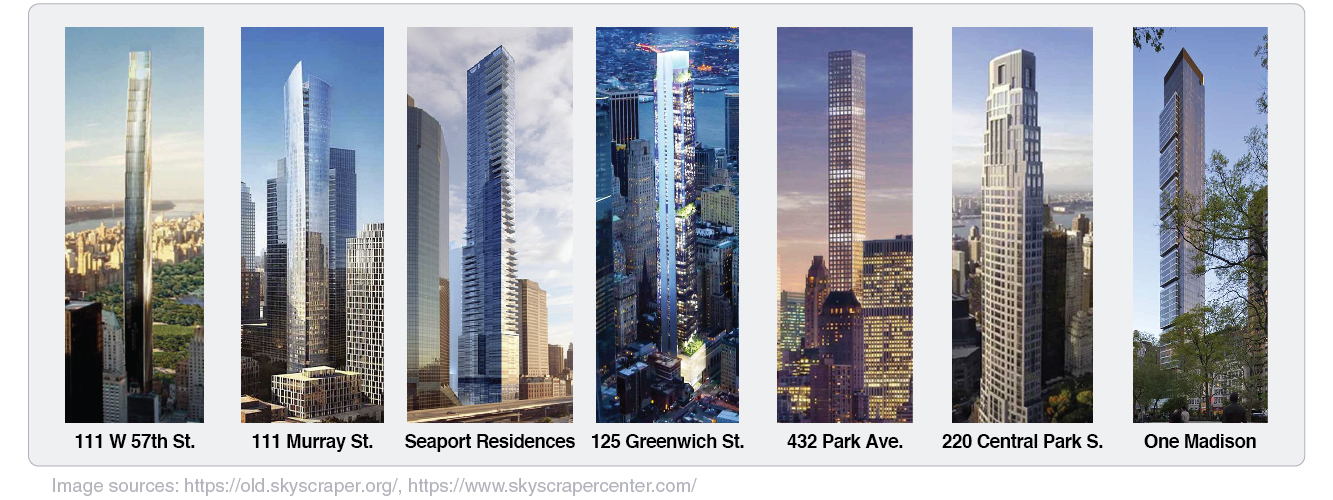
The slenderness of a building can be approximated by the aspect ratio of the building's height and width. For example, if a building is 100 ft wide and 500 ft tall, the slenderness is 500/100 = 5. The slenderness index in this project was calculated by dividing the building height by the square root of the maximum and mean floor area. The existing buildings are ranked by their slenderness and plotted against the construction year. Note that the y-axis is not the height of the building but the slenderness, meaning that the points at the top are not necessarily taller. As seen in the plot, the top 10 slender buildings were all constructed in the last 15 years; furthermore, most of the top 100 slender buildings were built in the past 20 years. This clearly tells us that skinny buildings are the new trend. Check out the images of these super-slender buildings below.
📝 Summary
The timeline of NYC's development can be summarized into four steps.
- Centralization (1880-1905)
The construction is centralized around Downtown Manhattan and Downtown Brooklyn. - Decentralization (1915-1935)
Urban sprawl starts, and the city expands towards Queens, Brooklyn, and the Bronx. - Saturation (1945-1965)
Urban sprawl reaches the perimeter of the city. - Recentralization (1980-2022)
The center of urban development is back in Manhattan. Slender buildings are built.
➡️ What's next?
A clear trend of "development follows infrastructure" can be found in the bubble maps. We can explore more how the development of infrastructure affects property development. How did the construction of bridges, tunnels, subway lines, and highways affect historical development? Then what should the next project be if we want to decentralize NYC again to solve urban problems? What neighborhoods will bloom from the proposed Rapid Transit Route?
Recently Prof. Jason Barr at Rutgers University proposed a massive extension of Manhattan Island ("New Mannahatta" project) to solve the housing shortage and prevent damages due to climate change. Would this be necessary? A horizontal expansion might not be necessary if the current trend of vertical expansion proves to be sustainable and effective. Future works are required if we would like to predict the impact of building New Mannahatta.
Data Source
PLUTO
Publisher: NYC Department of City Planning
Last Updated: December 2021
NYC Building Footprints
Publisher: NYC Department of Information Technology & Telecommunications
Last Updated: Mar 2020
Decennial Census
Publisher: US Census Bureau
Last Updated: 2020
Cover image
Photo by Juliana Malta on Unsplash