🗽 Introduction
New York, New York
The Big Apple. The city that never sleeps. Empire City, the Capital of the World, the Center of the Universe — New York is one of the most famous, populated, and culturally rich cities on the planet.
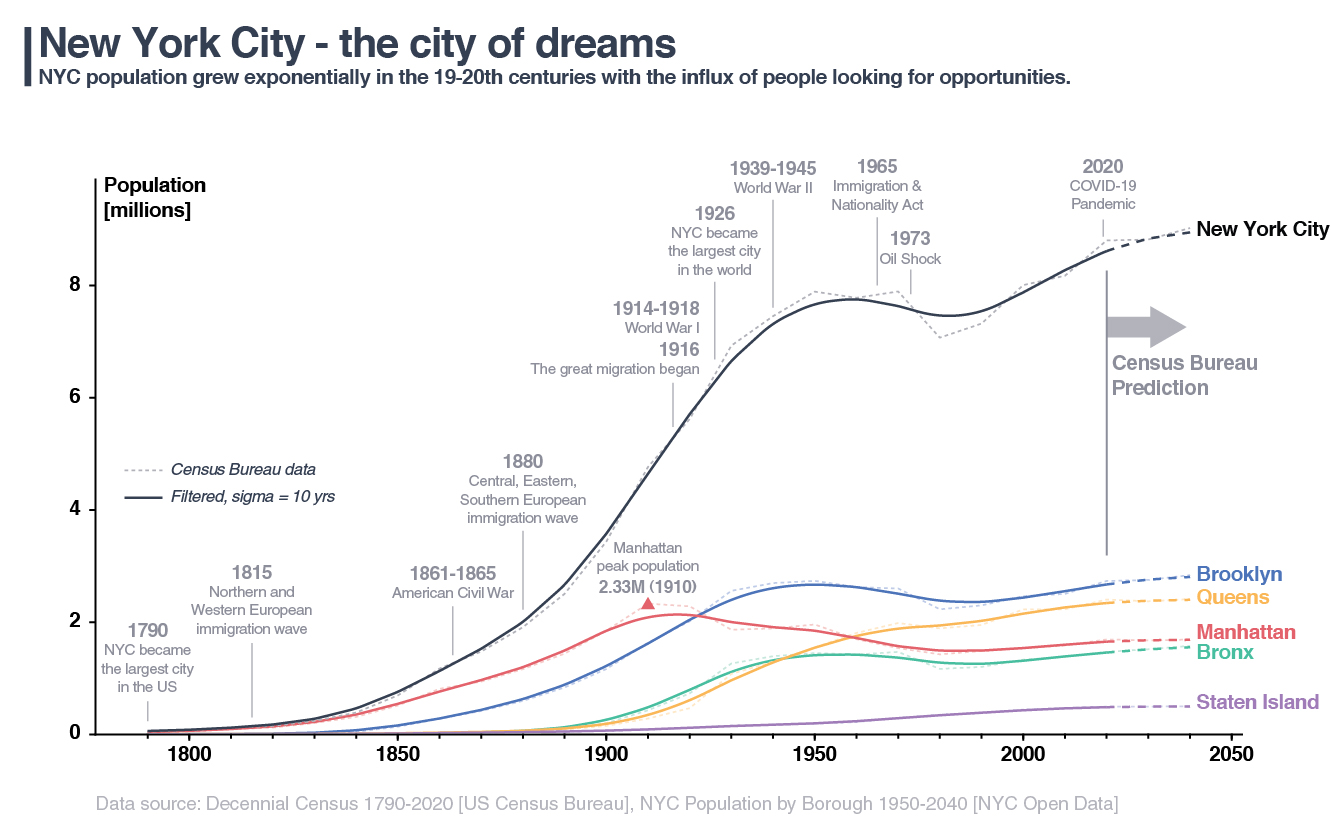
NYC's population grew exponentially in the 19th century, driven by successive waves of immigration. The graph below tracks the city's population since the first US Census in 1790. Each wave left its mark: Northern and Western Europeans in the 1810s, Central and Eastern Europeans in the 1880s, African Americans from the South during the Great Migration of the 1920s, and immigrants from Asia and Latin America following the Immigration and Nationality Act of 1965. The 2020 Census recorded 629,000 new residents over the past decade — a 7.7% increase — bringing the city's population density to over 27,000 people per square mile, the highest of any major US city.
The borough breakdown is equally telling. Manhattan's population peaked at 2.33 million in 1910 — nearly 40% more than today — before other boroughs caught up. Brooklyn surpassed Manhattan in 1930; Queens followed in 1960.
Population growth is a strong indicator of urban vitality. But can we visualize how the city physically expanded over time? How did different neighborhoods bloom during different eras? And what do those patterns tell us about how and why communities developed where they did?
Buildings of New York City
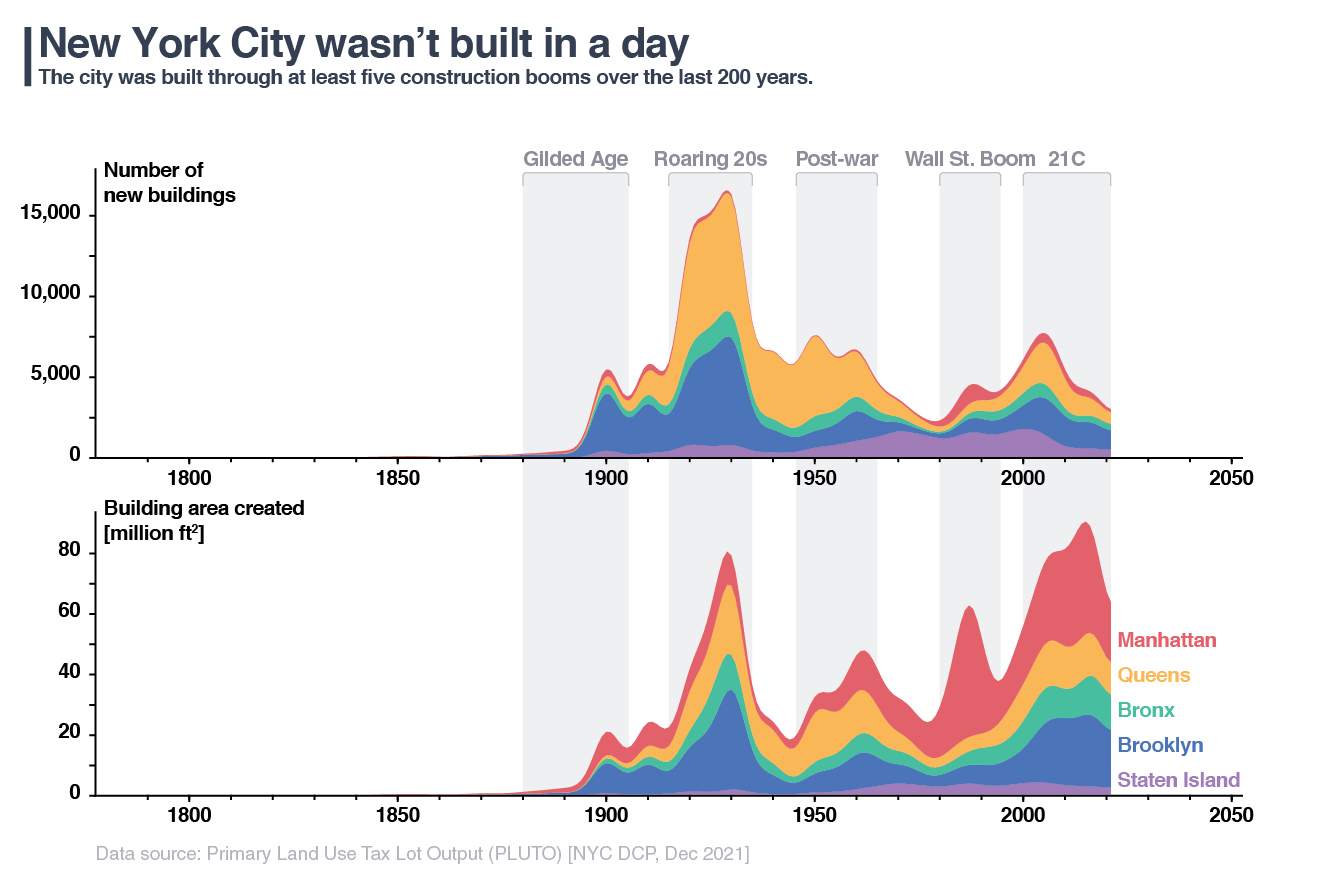
Like Rome, NYC wasn't built in a day. Construction data offers a direct window into urban development, and the NYC Department of City Planning maintains a dataset of all currently existing buildings — over 800,000 in total. The stacked area charts below show the number of buildings constructed each year (top) and the total floor area added (bottom). Note that since only surviving buildings are included, older periods are underrepresented.
Five distinct construction booms emerge from the data: the Gilded Age (1880–1905), the Roaring Twenties (1915–1935), the Post-War Era (1945–1965), the Wall Street Boom (1980–1995), and the 21st Century (2000–present). Construction wasn't evenly distributed across boroughs during any of these periods — the center of development shifted with each boom, and new neighborhoods bloomed in its wake. That's what this project sets out to explore.
🏗️ The Five Booms
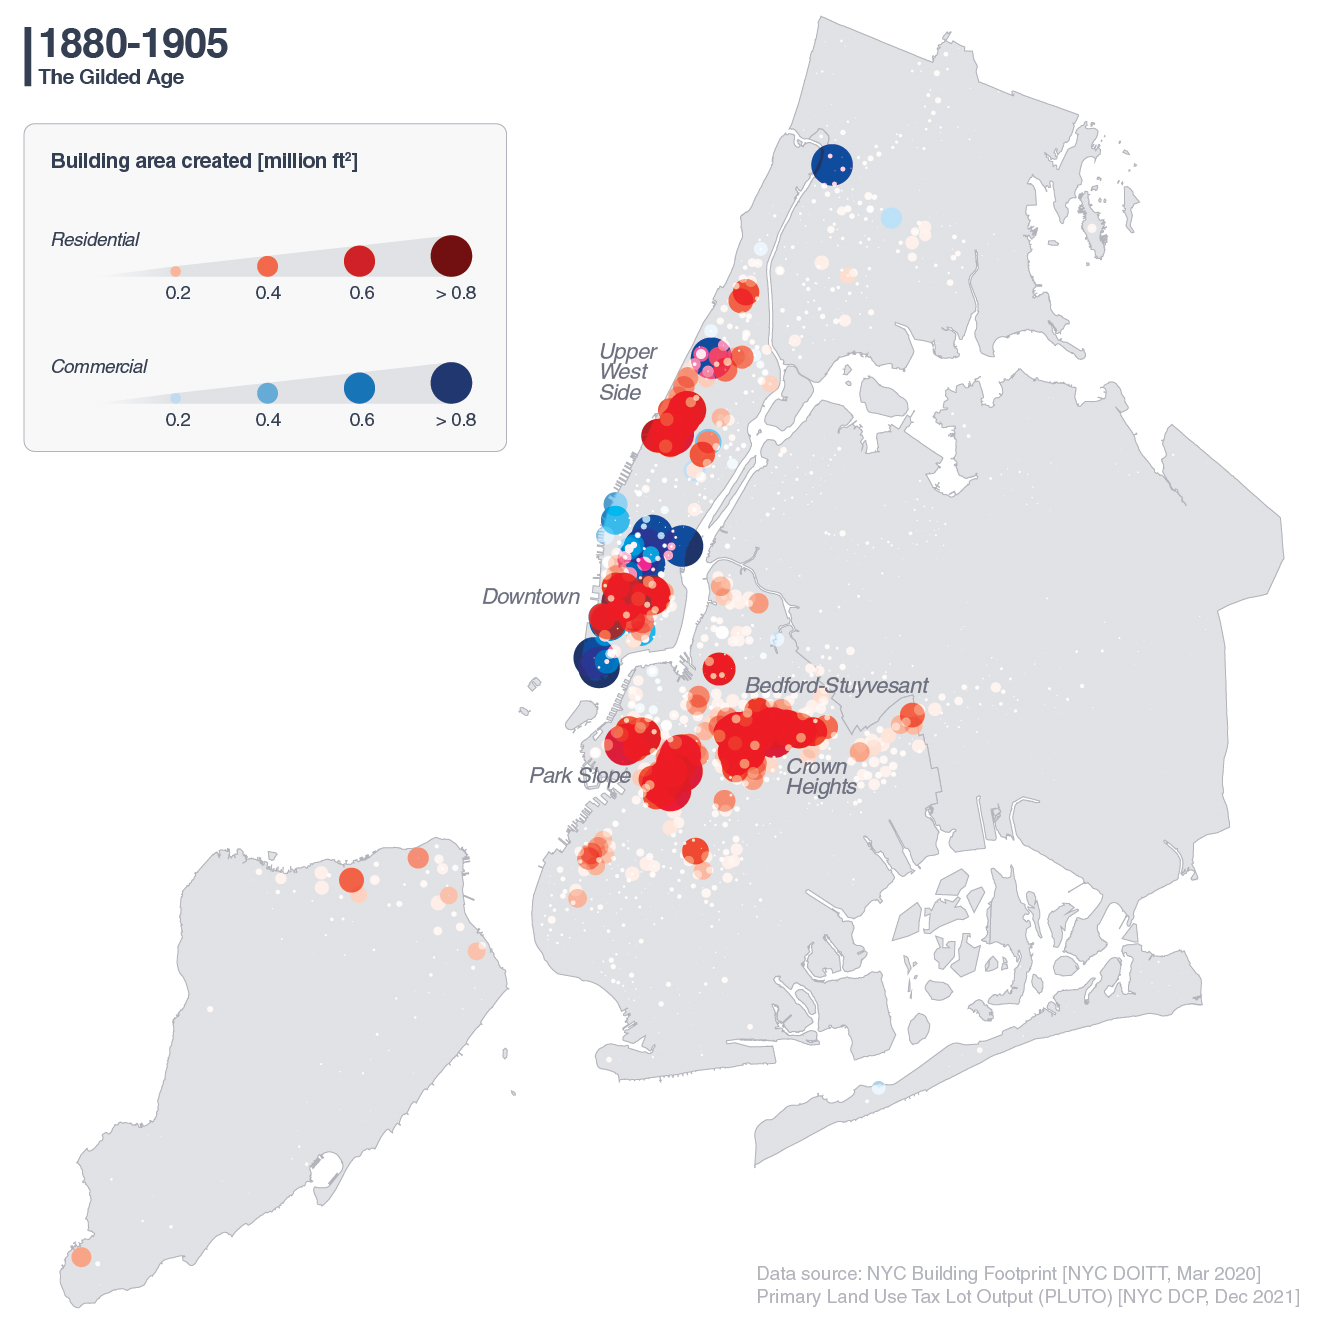
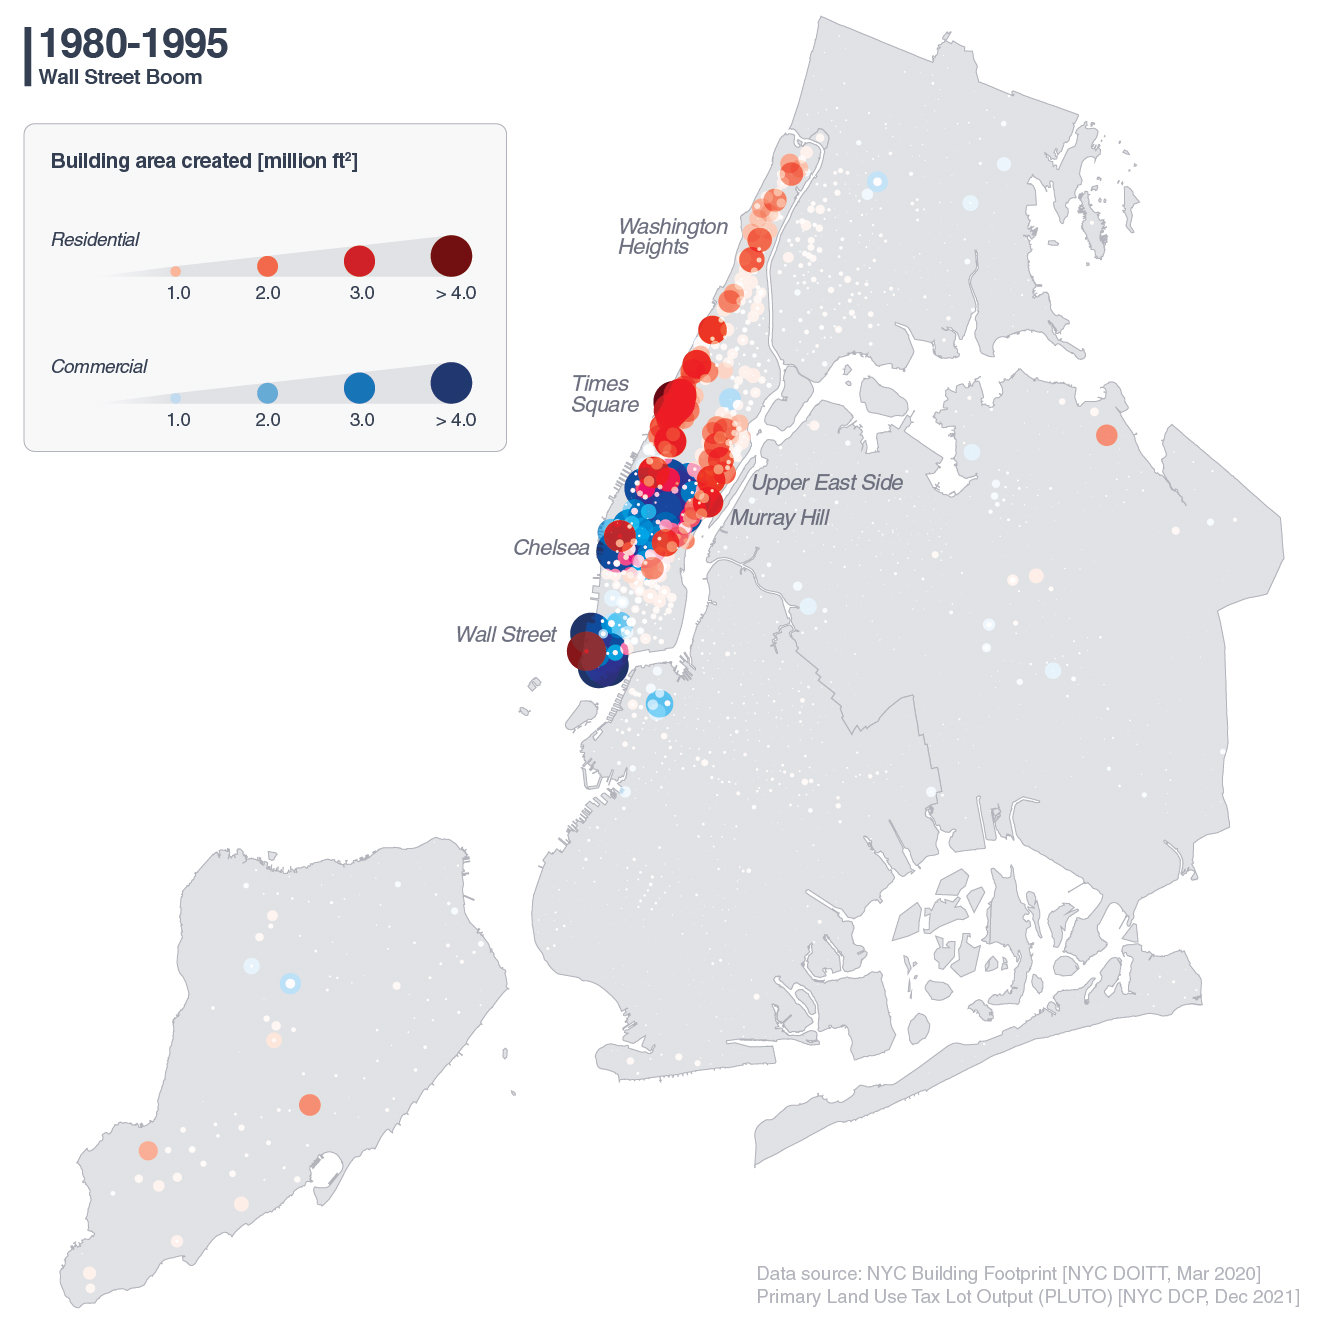
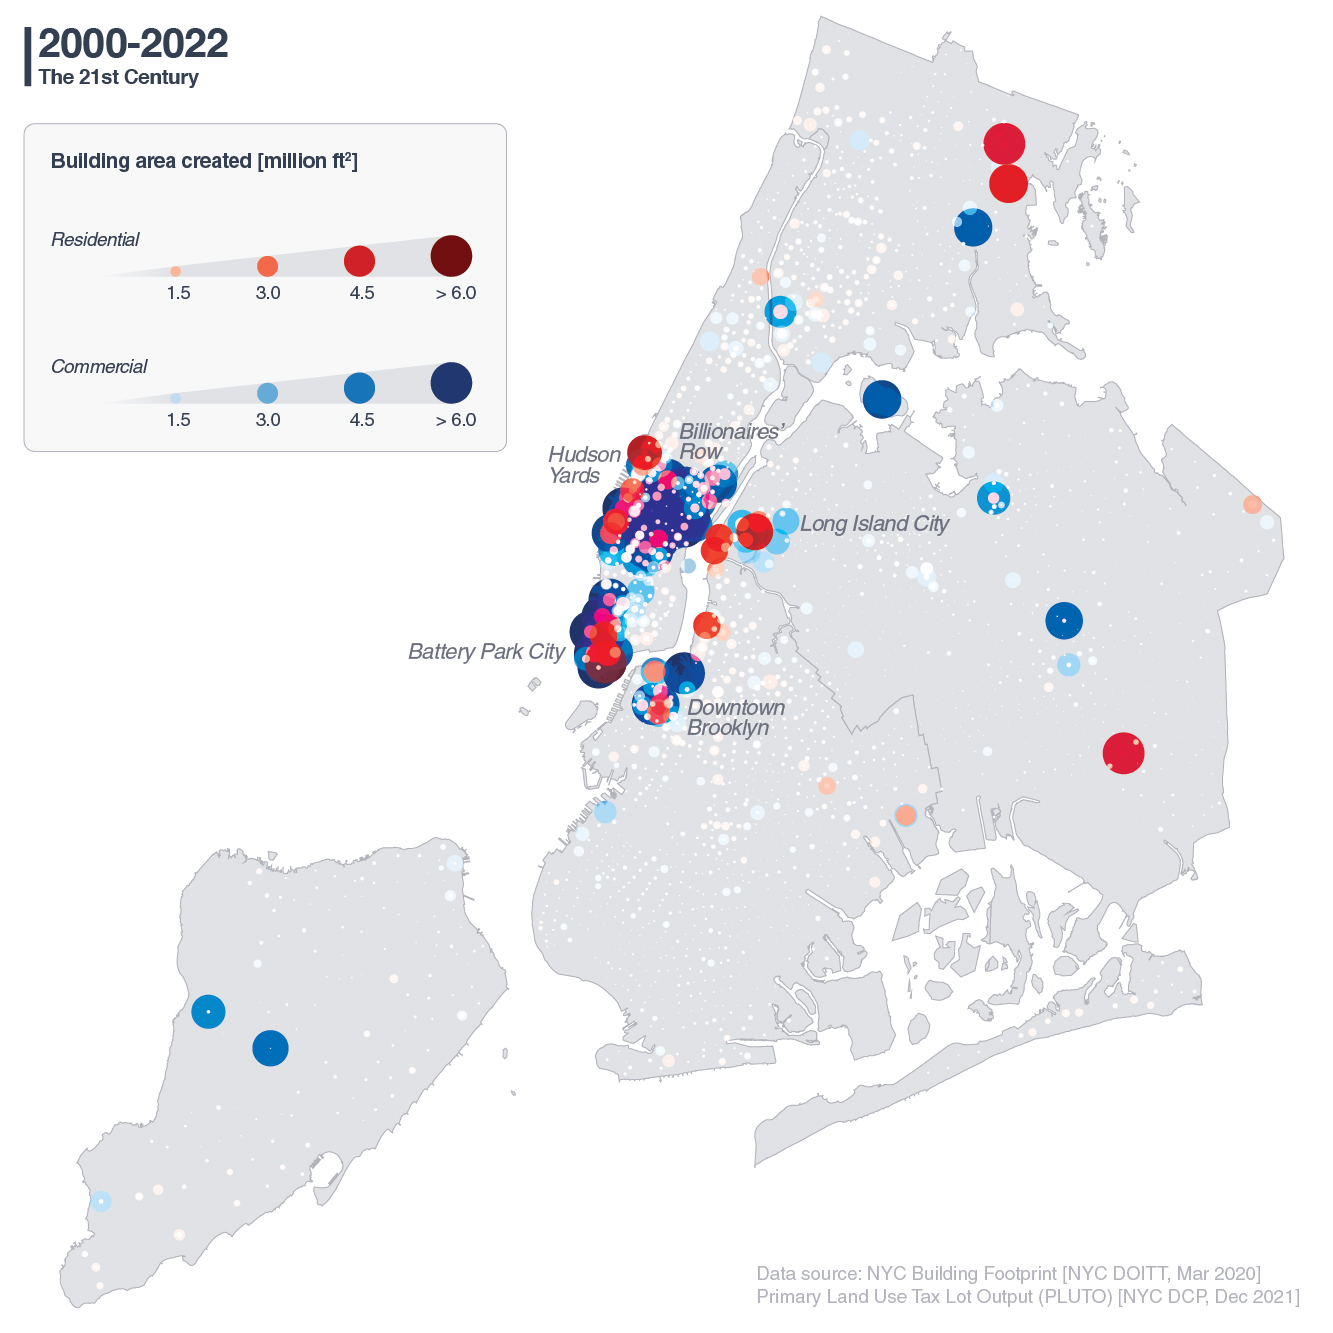
Each construction boom is visualized as a bubble map. Bubble size represents the total new building area added per census tract. Red bubbles are residential; blue are commercial.
The Gilded Age (1880–1905)
The city's first major boom centered on Downtown Manhattan and Downtown Brooklyn. Luxurious mansions lined 5th Avenue, while large-scale developments took shape near the central business districts. At this stage, the city was still young, and growth was concentrated close to economic hubs. New buildings in Brooklyn were predominantly residential; in Manhattan, the mix leaned commercial.
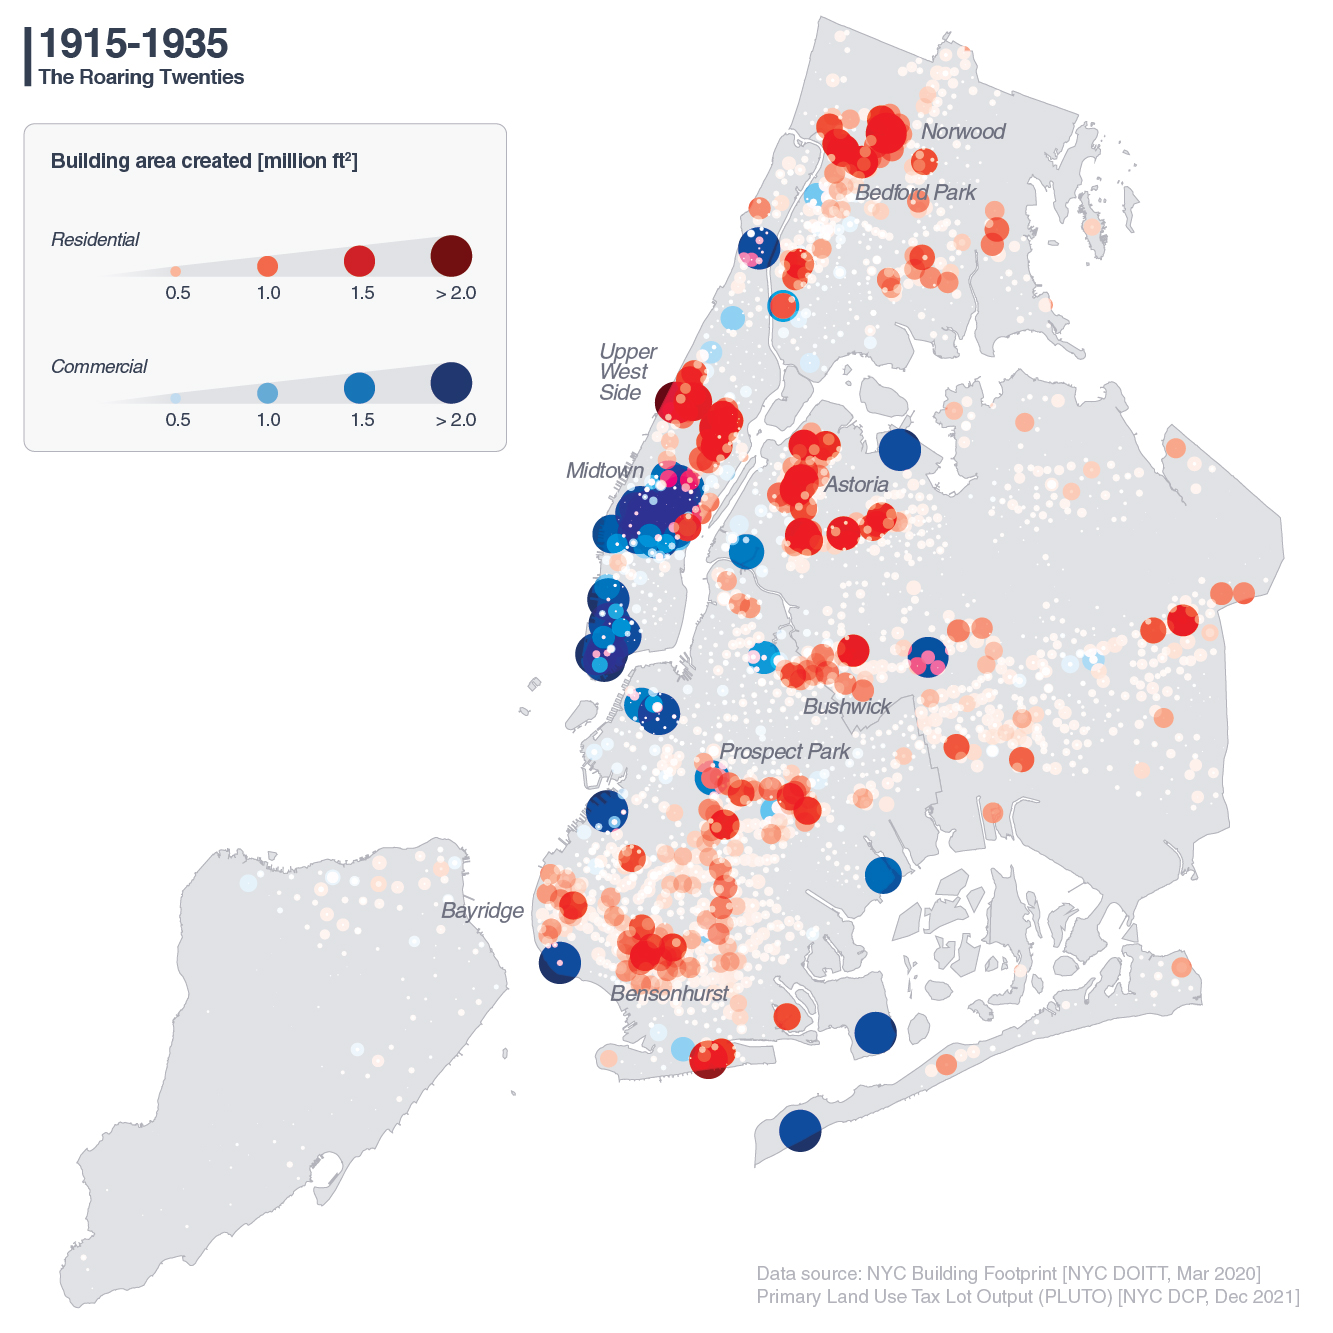
The Roaring Twenties (1915–1935)
The second boom coincided with the rapid expansion of the subway system. As new lines connected Manhattan to Queens, Brooklyn, and the Bronx, residential neighborhoods flourished in areas that had previously been out of reach — Astoria, Bushwick, Prospect Park, Bensonhurst, Bay Ridge, Norwood, and Bedford Park among them. The bubble map shows a clear urban sprawl pattern, with development radiating outward from the city's core.
Meanwhile, Midtown Manhattan came into its own as a commercial center. Some of New York's most iconic buildings were completed during this era: the Chrysler Building (1930), the Empire State Building (1931), and 30 Rockefeller Plaza (1933).
Post-War Era (1945–1965)
The third boom pushed urban sprawl to the city's outer edges. New residential neighborhoods emerged in Flushing, Fresh Meadows, Forest Hills, Jamaica, and Ozone Park in Queens, and in Coney Island in Brooklyn. By the end of this period, the city had effectively saturated — there was little accessible land left within city limits to develop. (Staten Island is excluded from this analysis; the Verrazzano-Narrows Bridge connecting it to Brooklyn wasn't completed until 1964.)

Wall Street Boom (1980–1995)
With the outer boroughs largely built out, the fourth boom brought construction back to Manhattan. Fueled by the rise of Wall Street, the Financial District saw renewed investment, while areas like Times Square, Washington Heights, Murray Hill, and the Upper East Side all experienced significant development. This period also marked the beginning of widespread gentrification across the city.
The 21st Century (2000–2022)
The current boom has doubled down on Manhattan and its immediate surroundings. Hudson Yards, Long Island City, Billionaires' Row, Downtown Brooklyn, and Battery Park City are all products of this era. With land scarce and property values sky-high, developers have turned upward — building not just tall, but extraordinarily slender. This trend is analyzed in detail below.
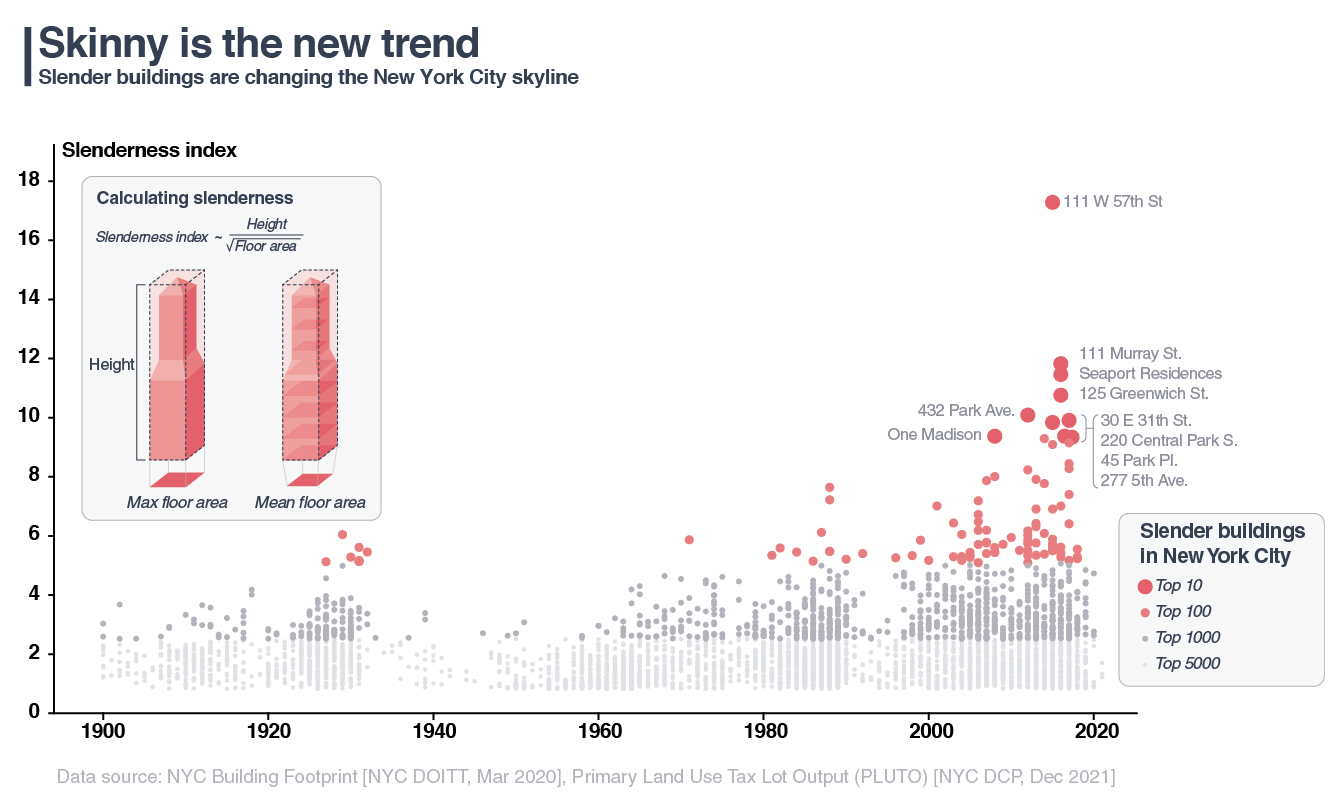
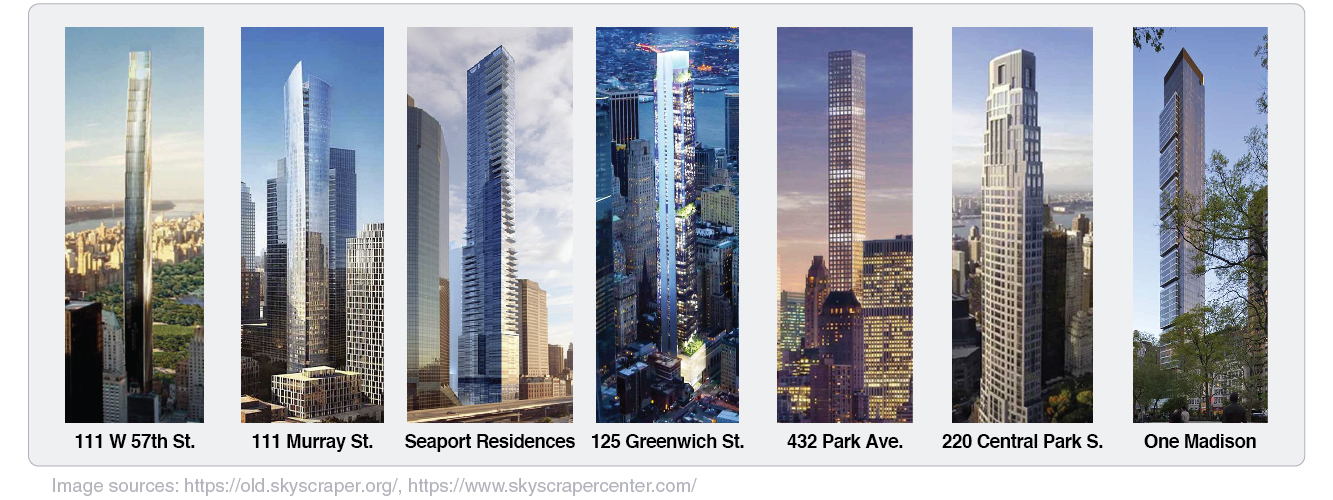
A building's slenderness can be approximated by its aspect ratio — height divided by width. If a building is 100 ft wide and 500 ft tall, the slenderness ratio is 5. In this project, the slenderness index was calculated by dividing building height by the square root of both the maximum and mean floor area. Plotting all existing buildings by slenderness against construction year tells a striking story: the top 10 slenderest buildings in NYC were all built in the last 15 years, and most of the top 100 were built in the past two decades. Skinny is the new tall.
📝 Summary
NYC's development follows a four-act arc:
- Centralization (1880–1905)
Growth concentrates around Downtown Manhattan and Downtown Brooklyn. - Decentralization (1915–1935)
Subway expansion drives urban sprawl into Queens, Brooklyn, and the Bronx. - Saturation (1945–1965)
Development reaches the city's perimeter; land runs out. - Recentralization (1980–present)
Construction returns to Manhattan. Buildings grow taller — and thinner.
➡️ What's Next?
The bubble maps suggest a recurring pattern: development follows infrastructure. Bridges, tunnels, subway lines, and highways have consistently unlocked new neighborhoods. This raises an interesting question — if the city wanted to decentralize again, what infrastructure investment would have the greatest impact? And which neighborhoods might bloom next?
It's also worth watching the proposed extensions to the NYC subway and bus rapid transit networks. History suggests that wherever those lines go, construction follows.
On a grander scale, Professor Jason Barr at Rutgers University has proposed extending Manhattan Island itself — the "New Mannahatta" project — as a potential solution to the housing shortage and climate vulnerability. Whether horizontal expansion will prove necessary depends largely on whether the current vertical trend can sustainably meet the city's needs. That's a question worth exploring further.
Data Sources
PLUTO
Publisher: NYC Department of City Planning
Last Updated: December 2021
NYC Building Footprints
Publisher: NYC Department of Information Technology & Telecommunications
Last Updated: March 2020
Decennial Census
Publisher: US Census Bureau
Last Updated: 2020
Cover image
Photo by Juliana Malta on Unsplash