NYC 311 Map
A map-first web and mobile app for exploring NYC 311 complaints, building permits, and property records at the building level — with neighborhood Insights and an annual Wrapped.
Introduction
New York City generates an astonishing amount of civic data. Every pothole report, noise complaint, illegal parking ticket, and housing violation gets logged, timestamped, and published. But this data is not easy to access, not visualized in the portal, and hard to search by address. NYC 311 Map is my attempt to fix that.
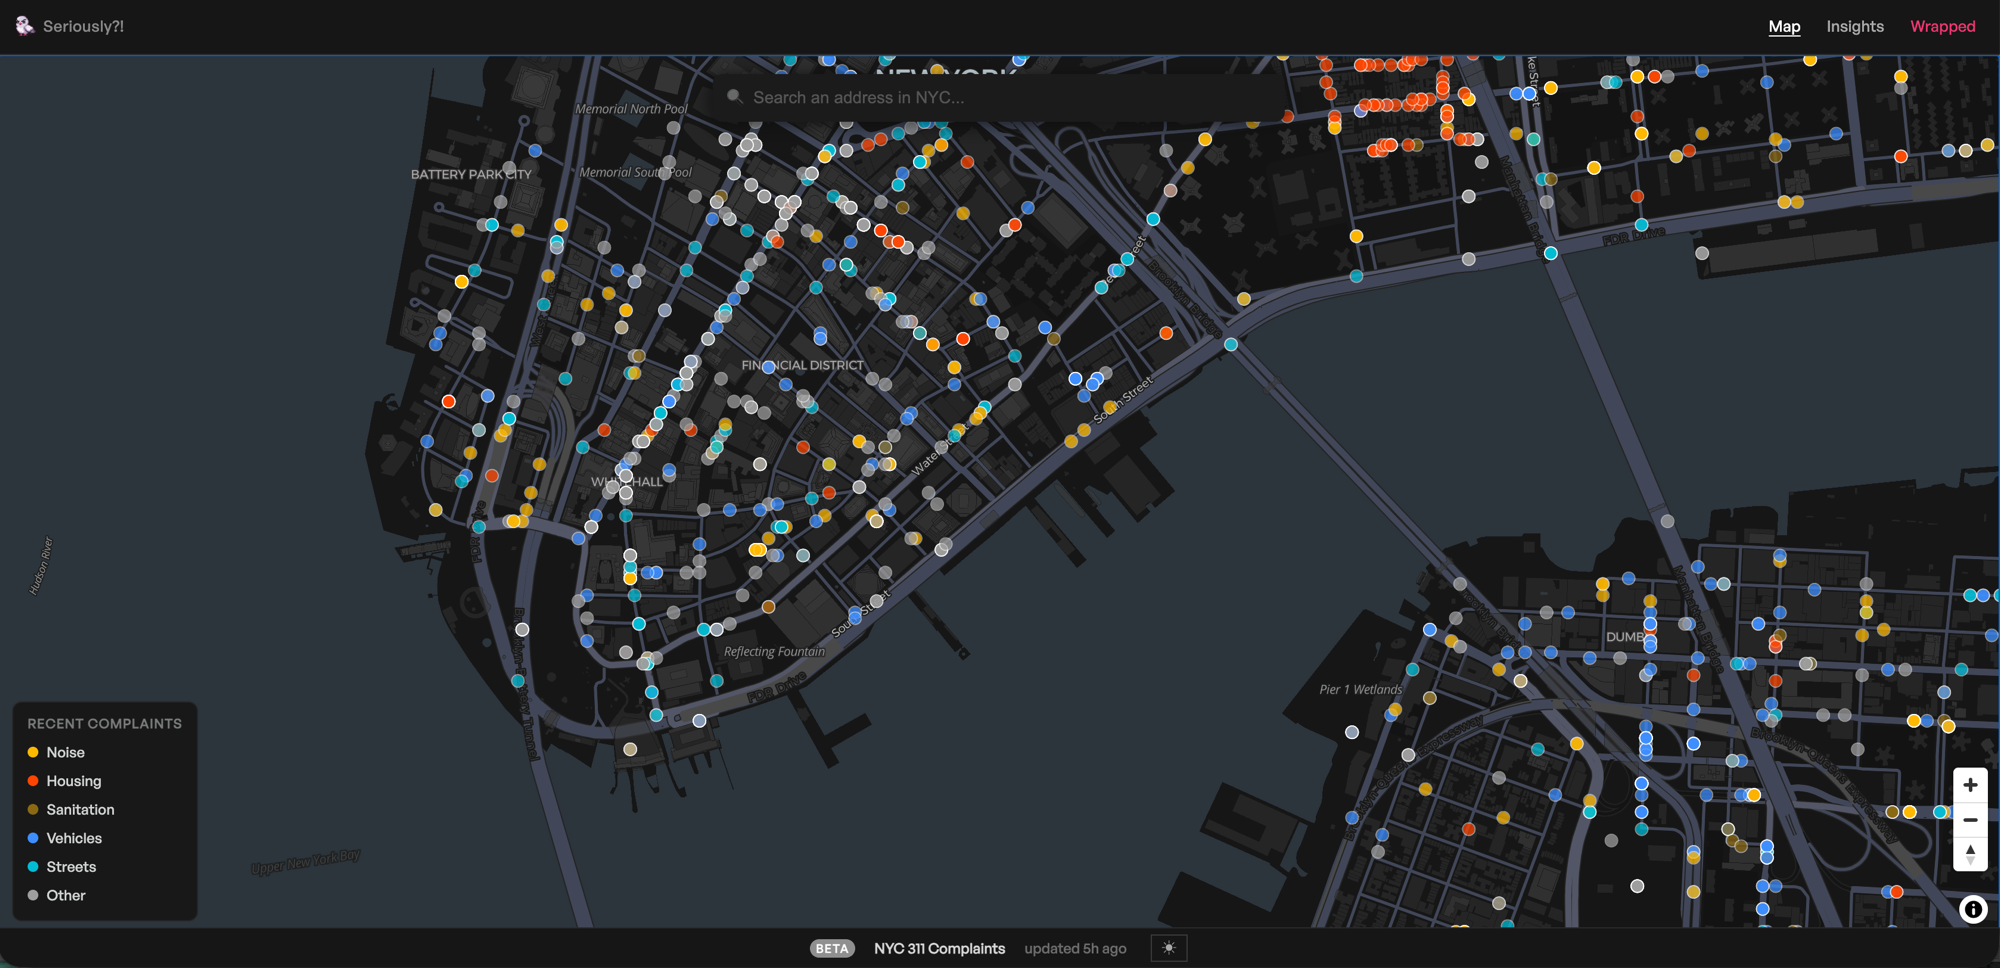
The homepage: a full-screen dark-mode map of NYC. Color-coded dots show recent 311 complaints — noise, housing, sanitation, vehicles, streets, and more. Updated every few hours.
What Is It?
NYC 311 Map is a map-first web app that lets you look up any building in New York City and instantly see the nearby311 complaint, Department of Buildings permit activity, property ownership details, and sales records — all in one place. (I still need to polish this - because I started this as a NYC building info app, but I got hooked into the 311 data and now I'm trying to make this fully a 311-related app.) Type in an address, click a building on the map, and a panel slides in with the full story of that property.
The app is live at 311.chadloh.com.
The Problem
Imagine you're moving to a new apartment in Brooklyn. You want to know: has this building had recurring noise complaints? Any open violations? Is the landlord currently doing major construction? These are public records — but to find them, you'd need to visit the NYC Open Data portal, the DOB BIS system, ACRIS for property records, and the 311 portal separately. None of them talk to each other. None of them let you just type an address and get answers.
The same problem exists for journalists covering housing inequality, researchers studying neighborhood change, or community advocates tracking landlord behavior. The data is there. The tools aren't.
Key Features
Building Detail Panel
This is just a bonus panel that I need to polish further.
Every building in the five boroughs is identified by its BBL (Borough-Block-Lot) number — the key that ties together NYC's property, permit, and complaint databases. Click any building on the map and the panel shows:
311 complaint history — every complaint filed, by type, date, and resolution status
DOB permit history — new building permits, major alterations, elevator work, demolitions, and 30+ other permit types decoded into plain English
Property information — owner name, building photo, lot size, year built, zoning
Sales history — past transactions with dates and recorded prices
Insights: Data Stories About NYC
Beyond individual buildings, the app includes a series of data-driven map stories called Insights. Each one layers a choropleth map of neighborhood-level data with a written analysis of what the numbers actually mean. The maps are interactive — you can zoom in, explore specific neighborhoods, and watch the data come alive.
Here are some examples:
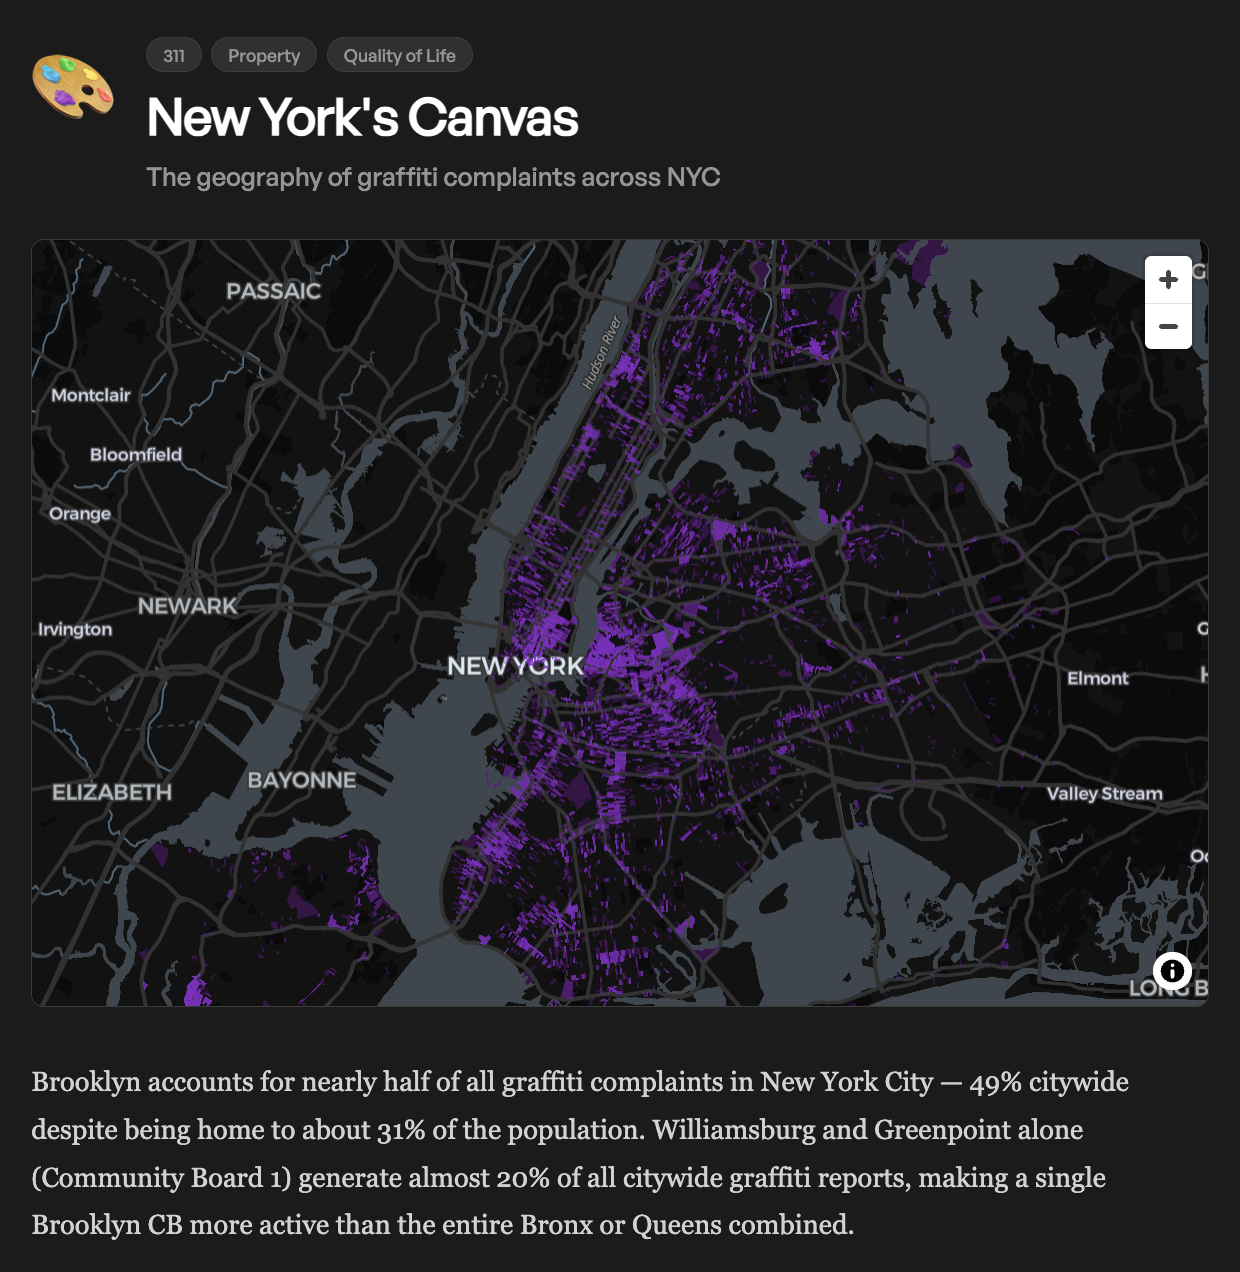
New York's Canvas: Brooklyn accounts for nearly half of all graffiti complaints citywide — 49%, despite being home to just 31% of the population. Williamsburg and Greenpoint alone generate almost 20% of all citywide graffiti reports.
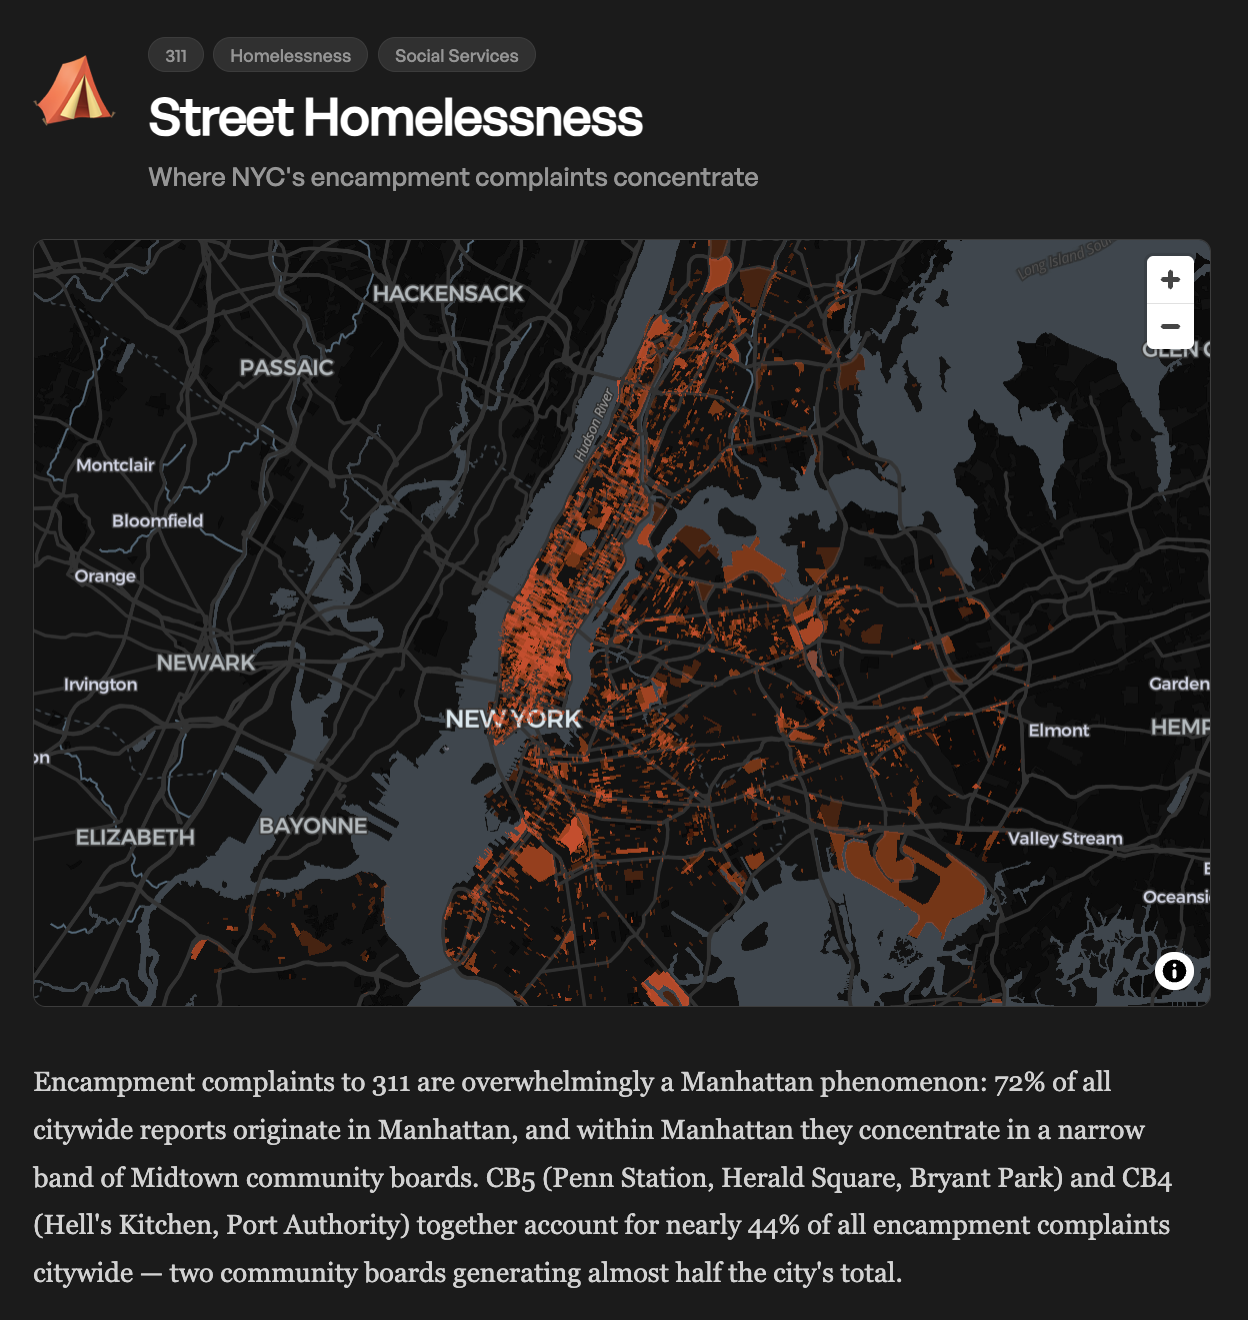
Street Homelessness: Encampment complaints are overwhelmingly a Manhattan phenomenon — 72% of all citywide reports originate there, concentrated in a narrow band of Midtown community boards.
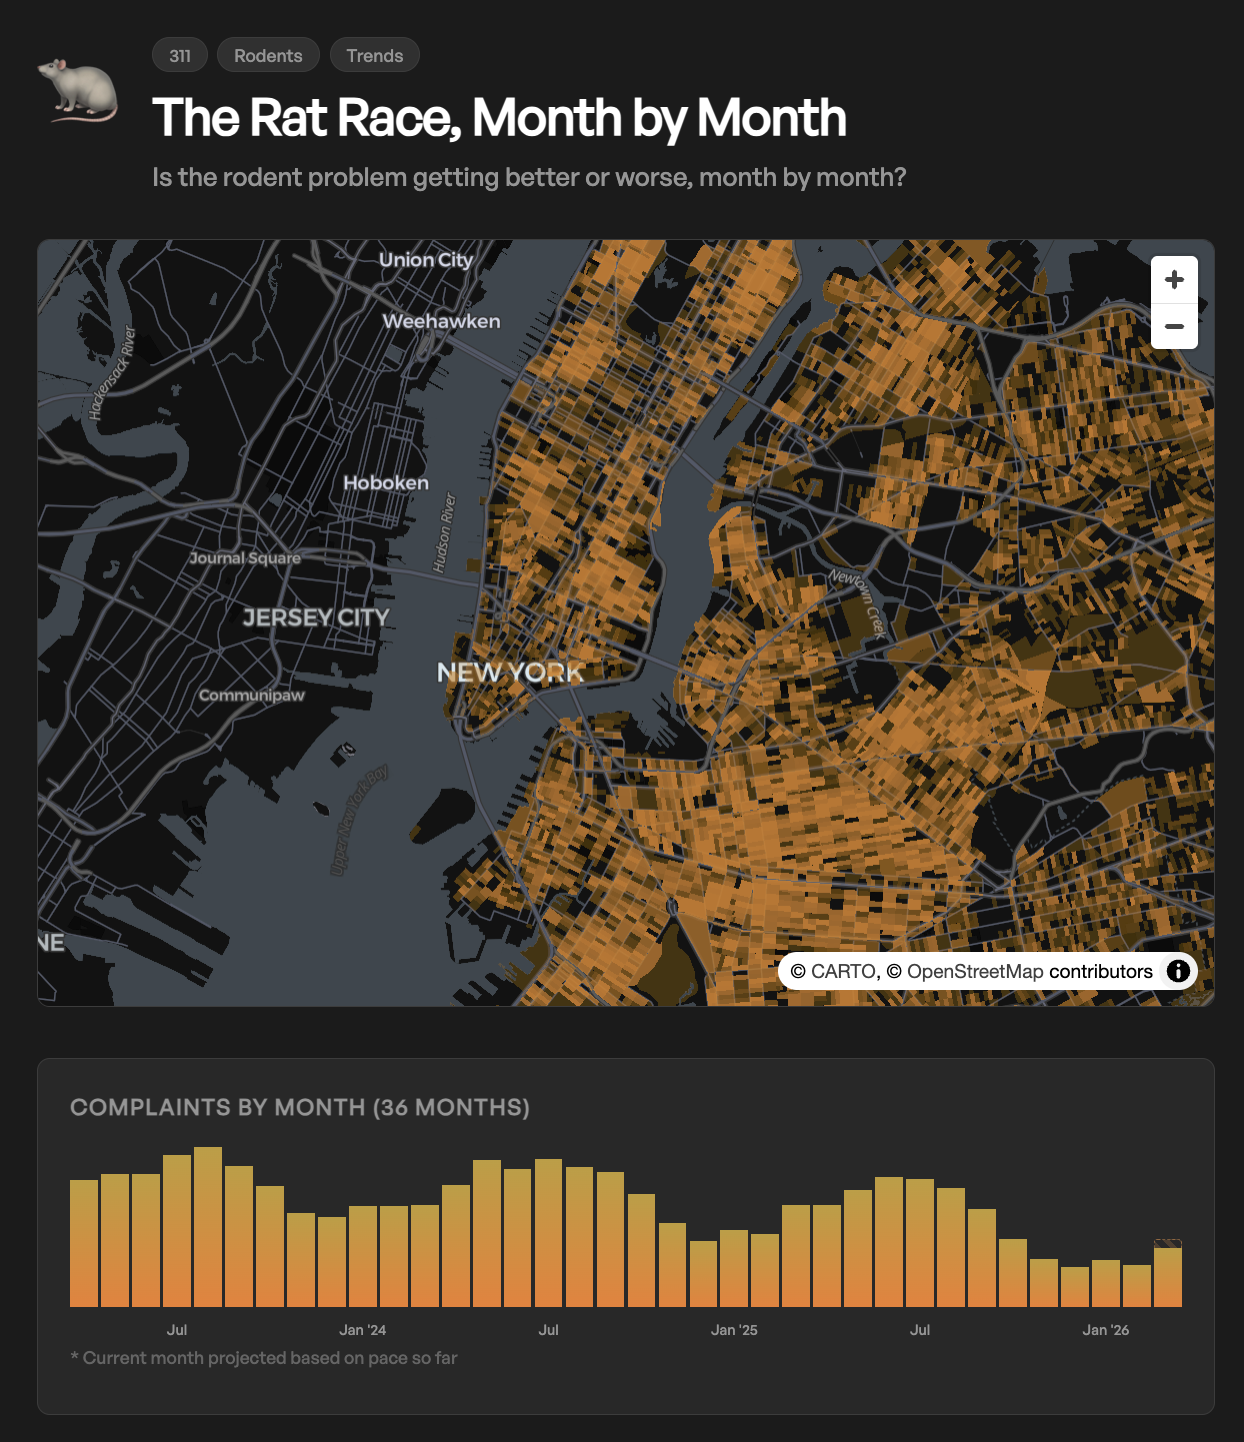
The Rat Race, Month by Month: Is the rodent problem getting better or worse? This insight maps rodent complaint density across the five boroughs, with a 36-month trend chart showing seasonality peaks in summer.
NYC Complaints Wrapped
Inspired by Spotify Wrapped, the NYC 311 Wrapped feature generates a shareable year-in-review for any address in the city. Enter your address and see what your neighborhood complained about most in 2025 — your top complaint types, how you compare to the rest of the city, and a neighborhood personality snapshot. Precomputed server-side for instant loading.
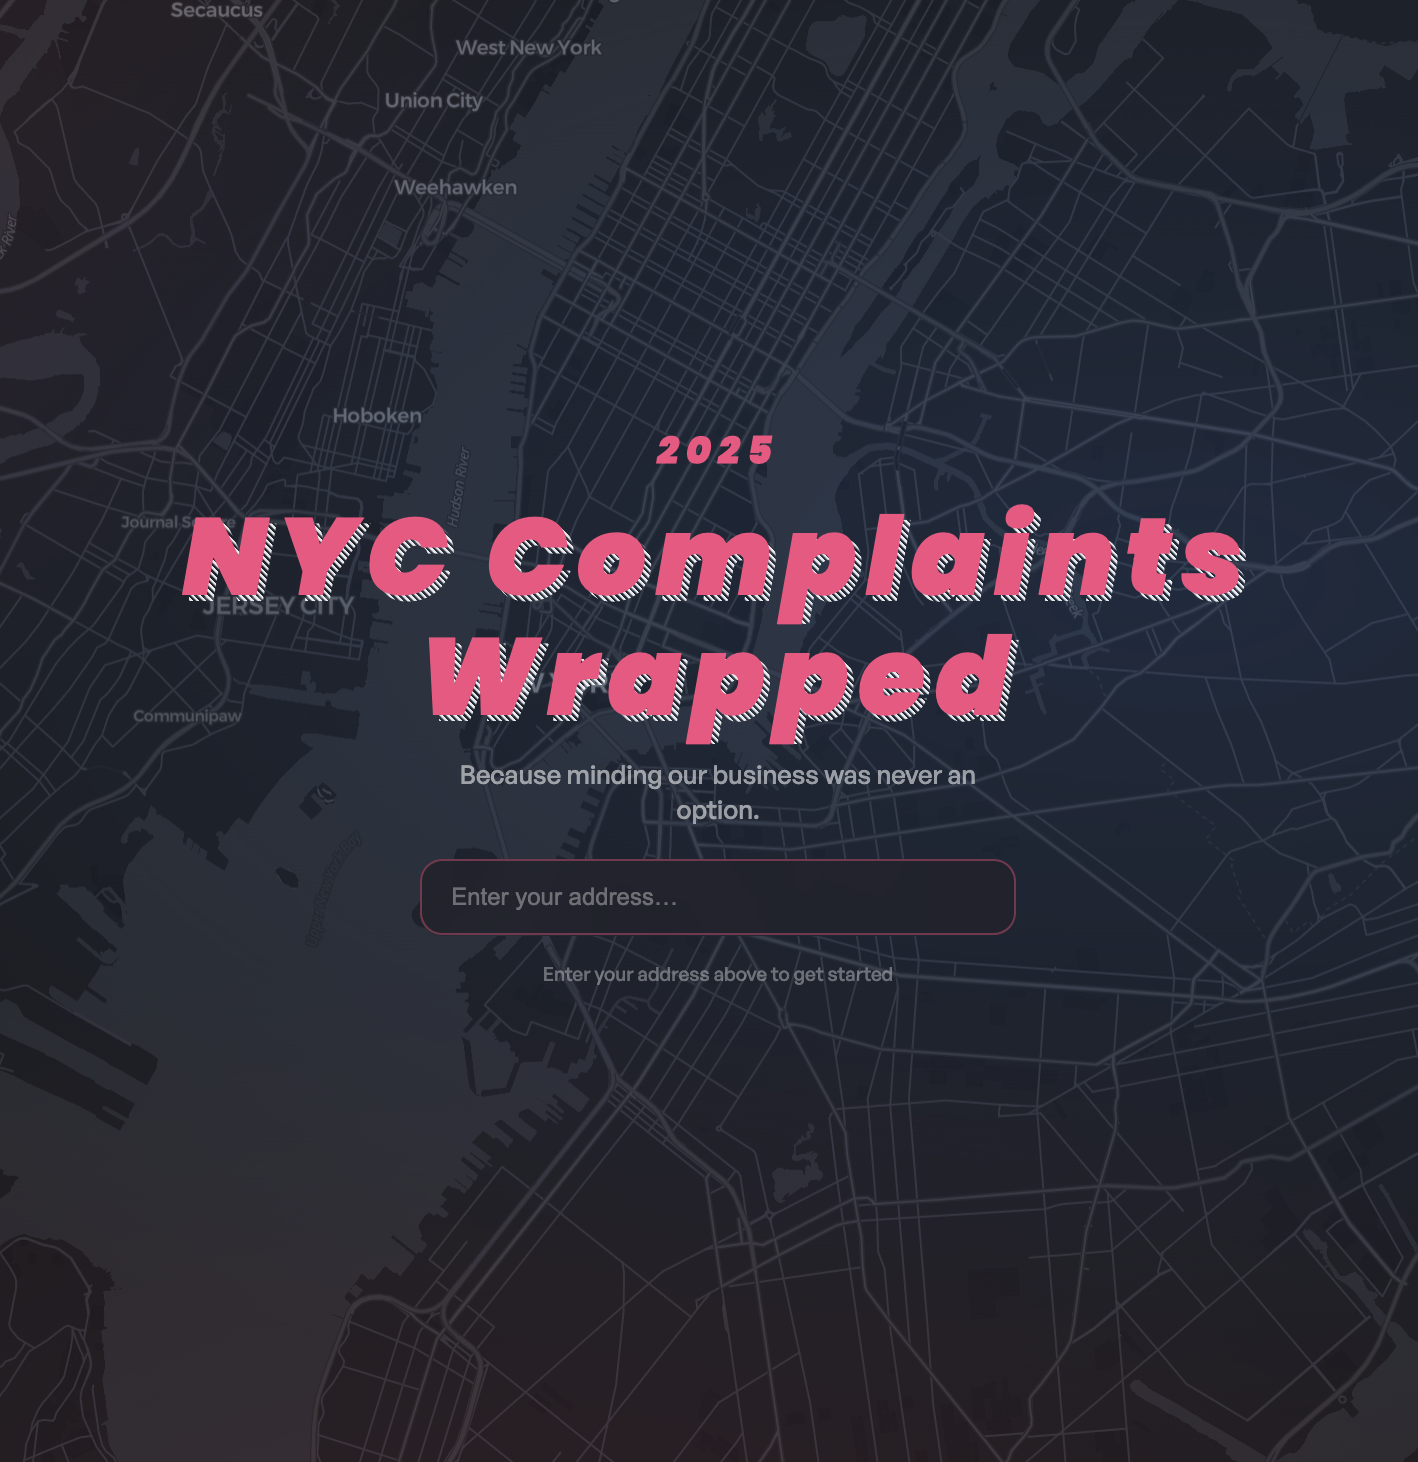
The Wrapped landing page. Enter any NYC address to see its 2025 complaint year-in-review.
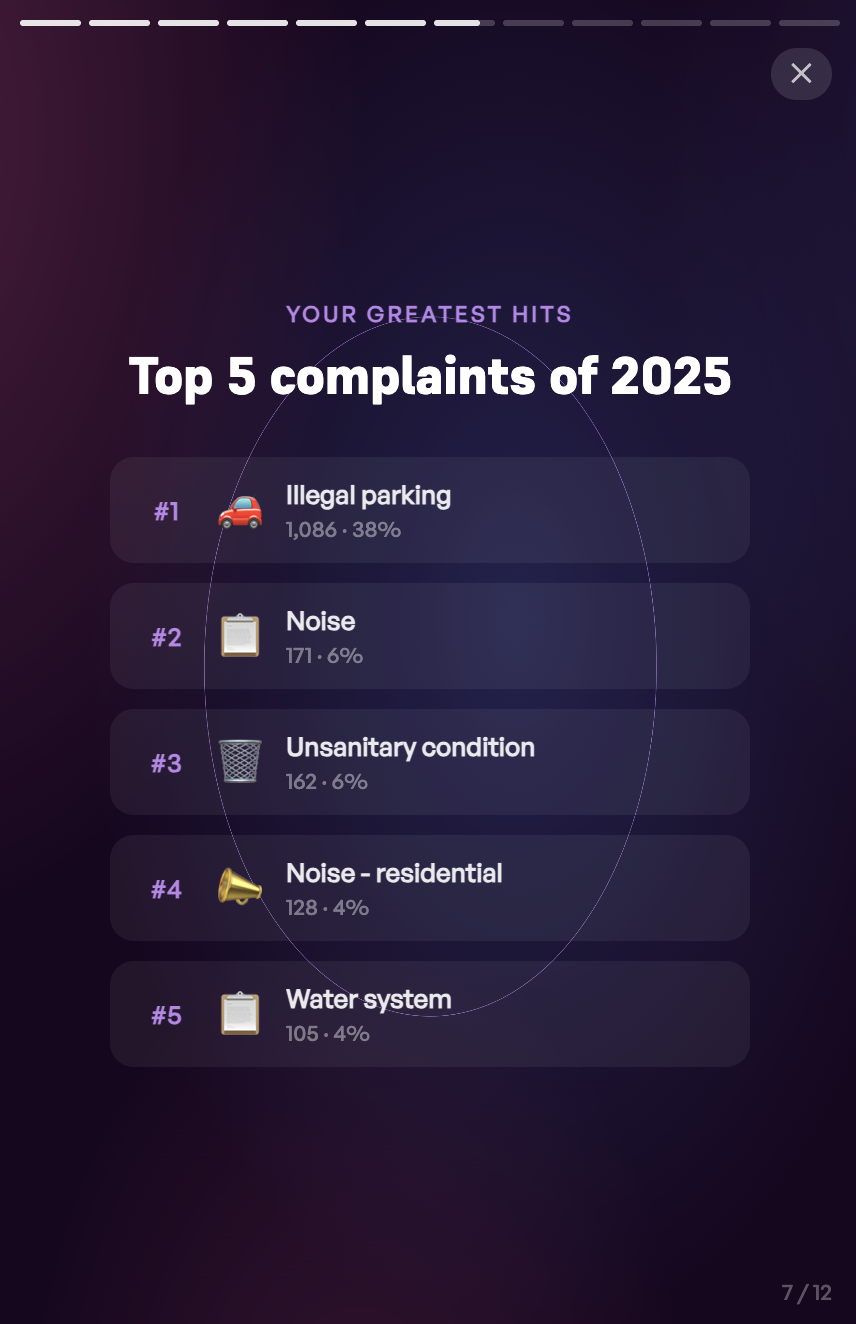
A Wrapped slide: the top 5 complaint types for a neighborhood in 2025. Illegal parking dominated at 38% of all complaints filed.
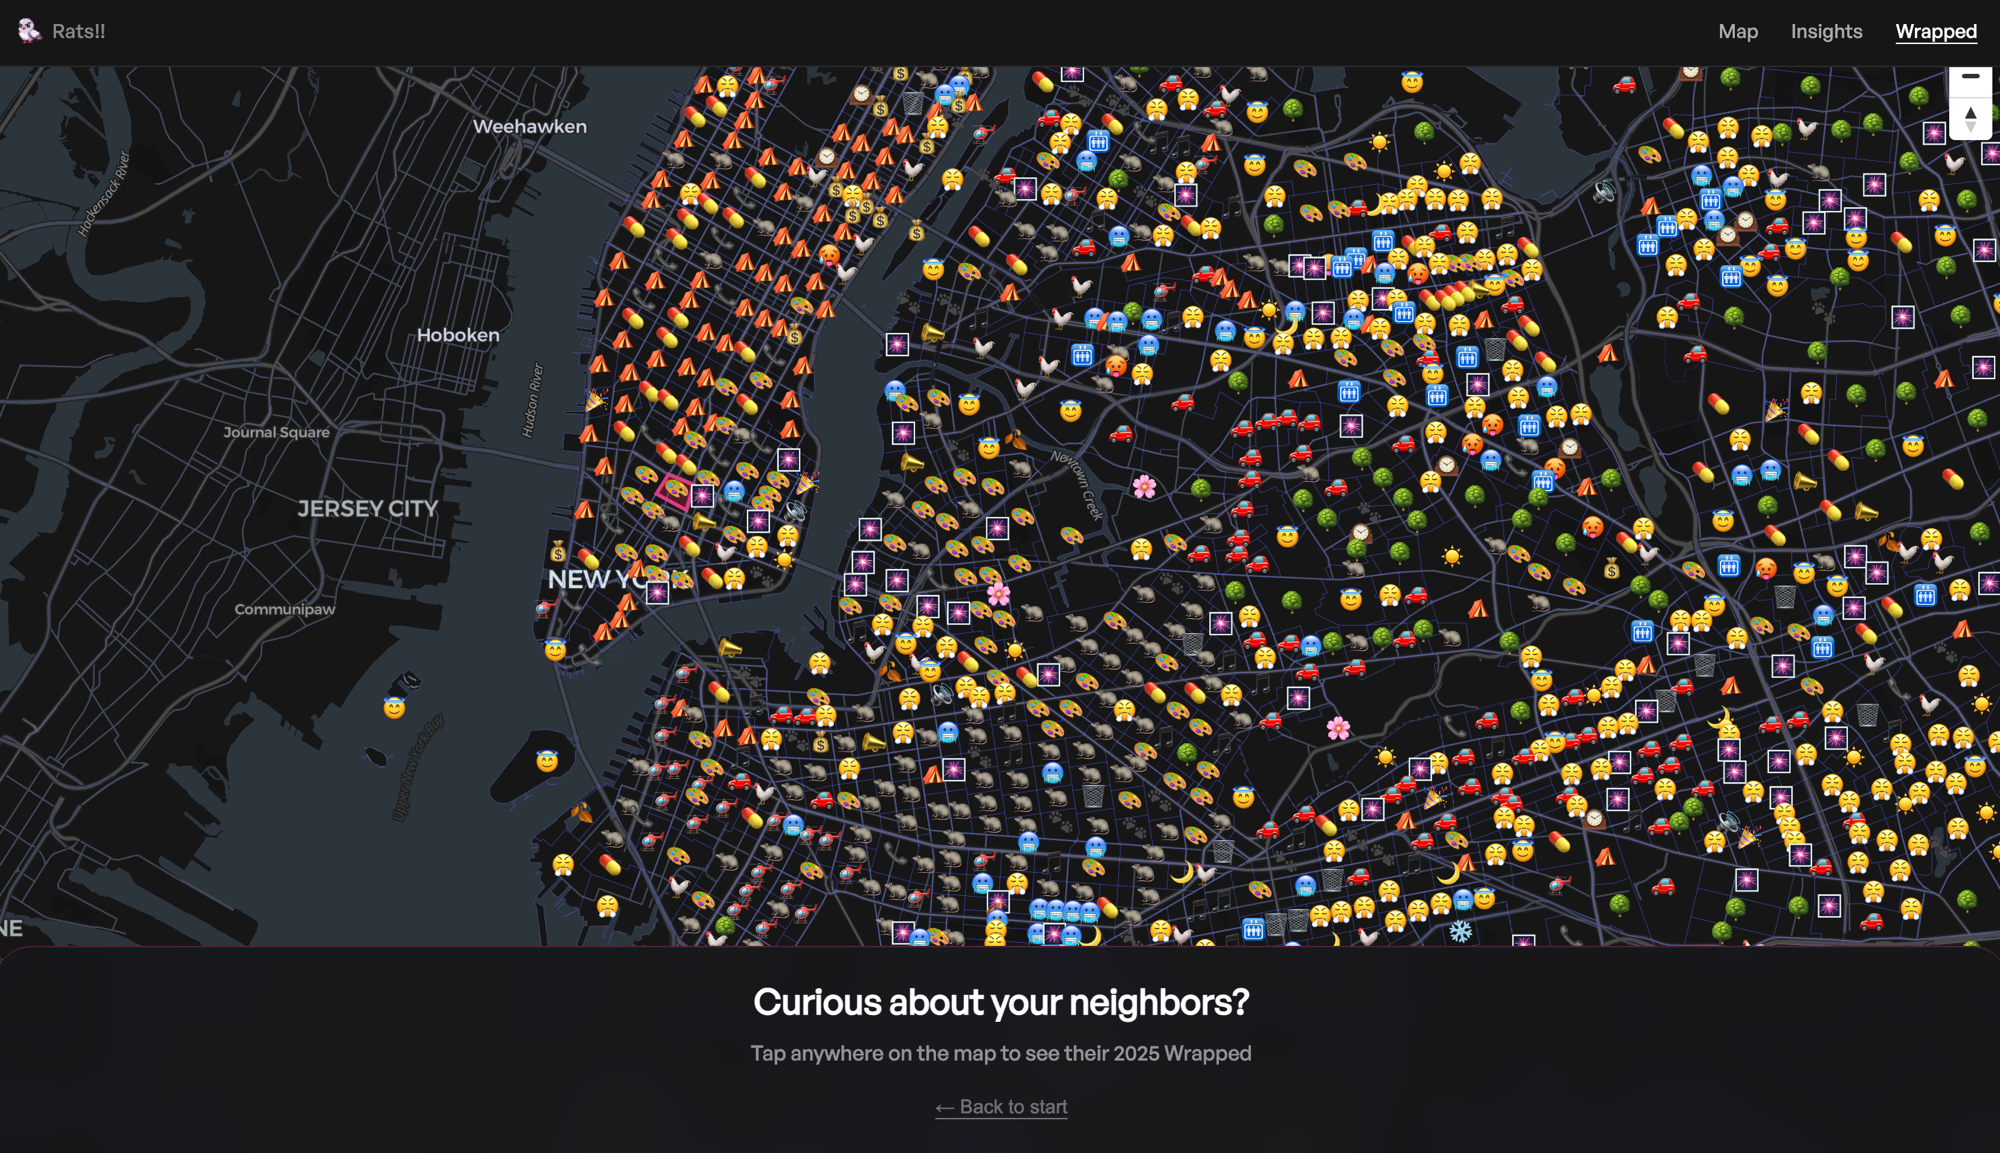
The Wrapped emoji map: every census tract shown with the emoji for its most distinctive complaint type. Tap any tract to see its own 2025 Wrapped.
Technical Architecture
Frontend
Stack: React 19 + Vite + TypeScript
Mapping: MapLibre GL v5 and
react-map-glfor interactive maps (MapLibre is the open-source fork of Mapbox GL; fully free, no proprietary API key required).Map Tiles: OpenFreeMap, fully open-source rendering.
Navigation: React Router v7 for client-side routing across the map view, Insights gallery, and individual data pages.
Backend
Stack: Node.js with Express v5, deployed as Vercel serverless functions.
Development: Local Express server mirrors production
/api/*routes for a consistent dev loop.Scheduled Jobs: Nightly data sync runs as a Vercel cron job at midnight UTC. It triggers a protected endpoint that:
Syncs permits and complaints in parallel
Rebuilds the heatmap and all precomputed choropleth data
Database
System: AWS RDS PostgreSQL with PostGIS
Spatial Queries:
Spatial joins to assign complaints to census blocks
Nearest-neighbor lookups for building selection
Bounding-box queries scoped to map viewport
Point-in-polygon tract lookups for neighborhood summaries
PLUTO Table (~1.1M rows):
GIN trigram index for fast fuzzy address autocomplete (
pg_trgmsimilarity scans, tolerant of minor street name variations)
BBL Key
Concept: BBL (Borough-Block-Lot) is NYC’s unique parcel identifier.
Purpose: Acts as a unifying key across 311 complaints, DOB permits, PLUTO property data, and ACRIS sales records.
Format: borough digit + 5-digit block + 4-digit lot (zero-padded)
Benefit: Enables precise relational joins across multiple datasets without fuzzy address matching.
Data Pipeline
Sources: NYC Open Data (Socrata API) for 311 complaints and DOB permits, PLUTO master property dataset (~1.1M parcels).
Sync Strategy:
Complaints: Two-pass incremental sync (new records + updated resolution status)
Permits: Incremental by issuance date
PLUTO: Bulk import when NYC Planning releases updates
Precomputed Aggregates:
23 Insights choropleth maps precomputed nightly per census block (spatial joins yield counts stored as city-wide GeoJSON)
Annual Wrapped neighborhood summaries precomputed at the census tract level
Try It
The app is live at 311.chadloh.com. Search your address, click your building, and see what the city knows about it.