The Problem
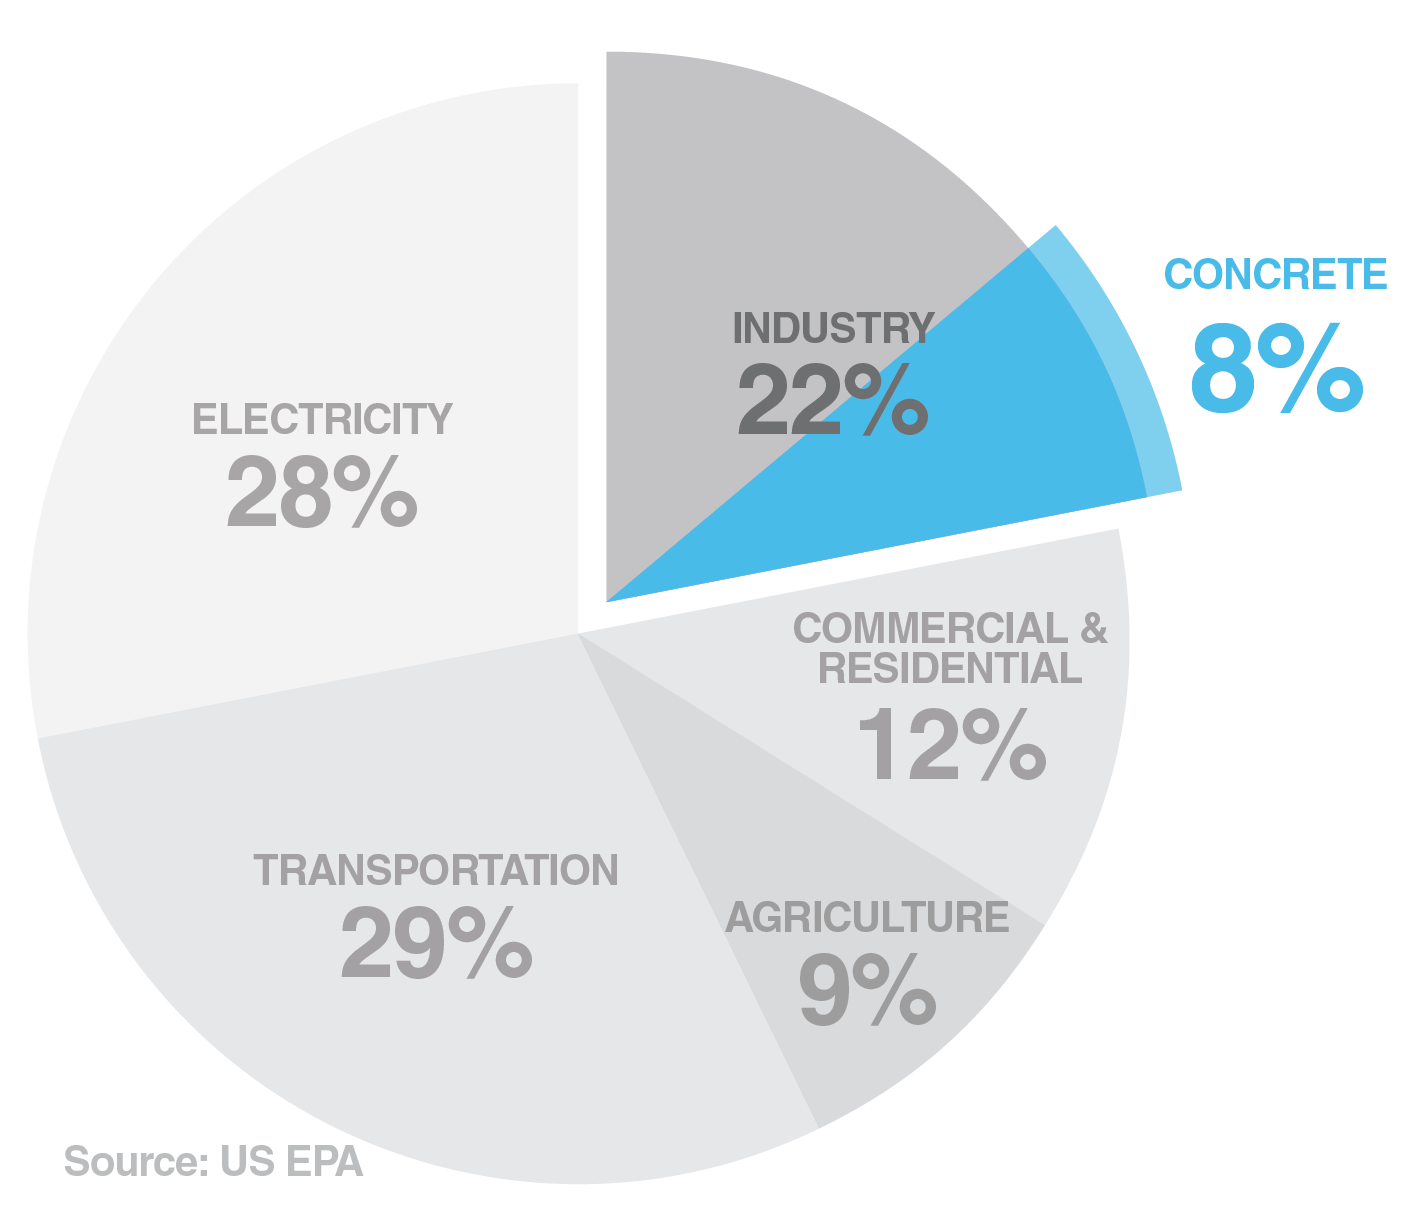
Concrete has a deceptively simple recipe: cement, water, and aggregates. Ordinary Portland cement (OPC) — the most widely used binder in modern concrete and mortar — is manufactured by heating crushed limestone to 1,450°C. This process is doubly carbon-intensive: it consumes enormous amounts of fuel, and CO₂ is a direct byproduct of the chemical reaction inside the kiln. Together, the cement industry is responsible for roughly 8% of global CO₂ emissions.
The Knowledge Gap
Knowing when concrete sets is critical: the material is only workable until setting begins, and setting marks the onset of strength and stiffness development. Yet after 2,000 years of use, we still lack a complete mechanistic picture of why concrete has an induction period and how the setting process unfolds at the molecular level. The fundamental difficulty is that cementitious materials are extraordinarily complex — and every characterization technique has its own blind spots.
Concrete is a remarkably rich deposit of interesting and contemporary research questions, all contained in its ambiguities: granular or continuous?, liquid or solid?, crystalline or glassy?, smooth or rough?, "porous", brittle or ductile?, material or process?
Van Damme
CCR (2018)
My answer is that concrete is, in fact, all of these things simultaneously — a multiscale, heterogeneous, and continuously evolving material. This is quantitatively demonstrated in my recent paper in Langmuir, from which the figures below are taken.
Data Structure and Dimension Reduction
A Raman data is collected using a custom-fabricated stage that enables in-situ Raman characterization while the sample cures underwater.
B The raw dataset D is a 2D array (n × ns), where n = nx × ny × nt is the total number of spectra and ns is the number of wavenumbers. Time-series data can be batched into nt sub-datasets Dk, each containing the spectra of nx × ny pixels. The full dataset D′ is a 4D array with spatial (nx × ny), temporal (nt), and spectral (ns) dimensions.
C Dimension Reduction 1: Average Raman spectra A are obtained by averaging CCD counts across all spatial points at each wavenumber.
D Dimension Reduction 2: Basis analysis (BA, analogous to PCA) decomposes the dataset into basis spectra B and spatial phase maps C.
E Dimension Reduction 3: Peak fitting extracts local chemical, mechanical, and crystallographic properties at each pixel by fitting a Lorentzian profile to individual peaks — standard for crystalline phases.

Raman Basis Analysis
Raman basis analysis applies PCA-style decomposition across 1,024 spectral features. After careful data cleaning and analysis, the following chemically meaningful components were identified.

Cement Hydration Mapping
This figure presents one of the key results: spatial component distributions visualized as heatmaps, with two-point correlations used to quantify hydration kinetics across the sample over time.
