The Problem
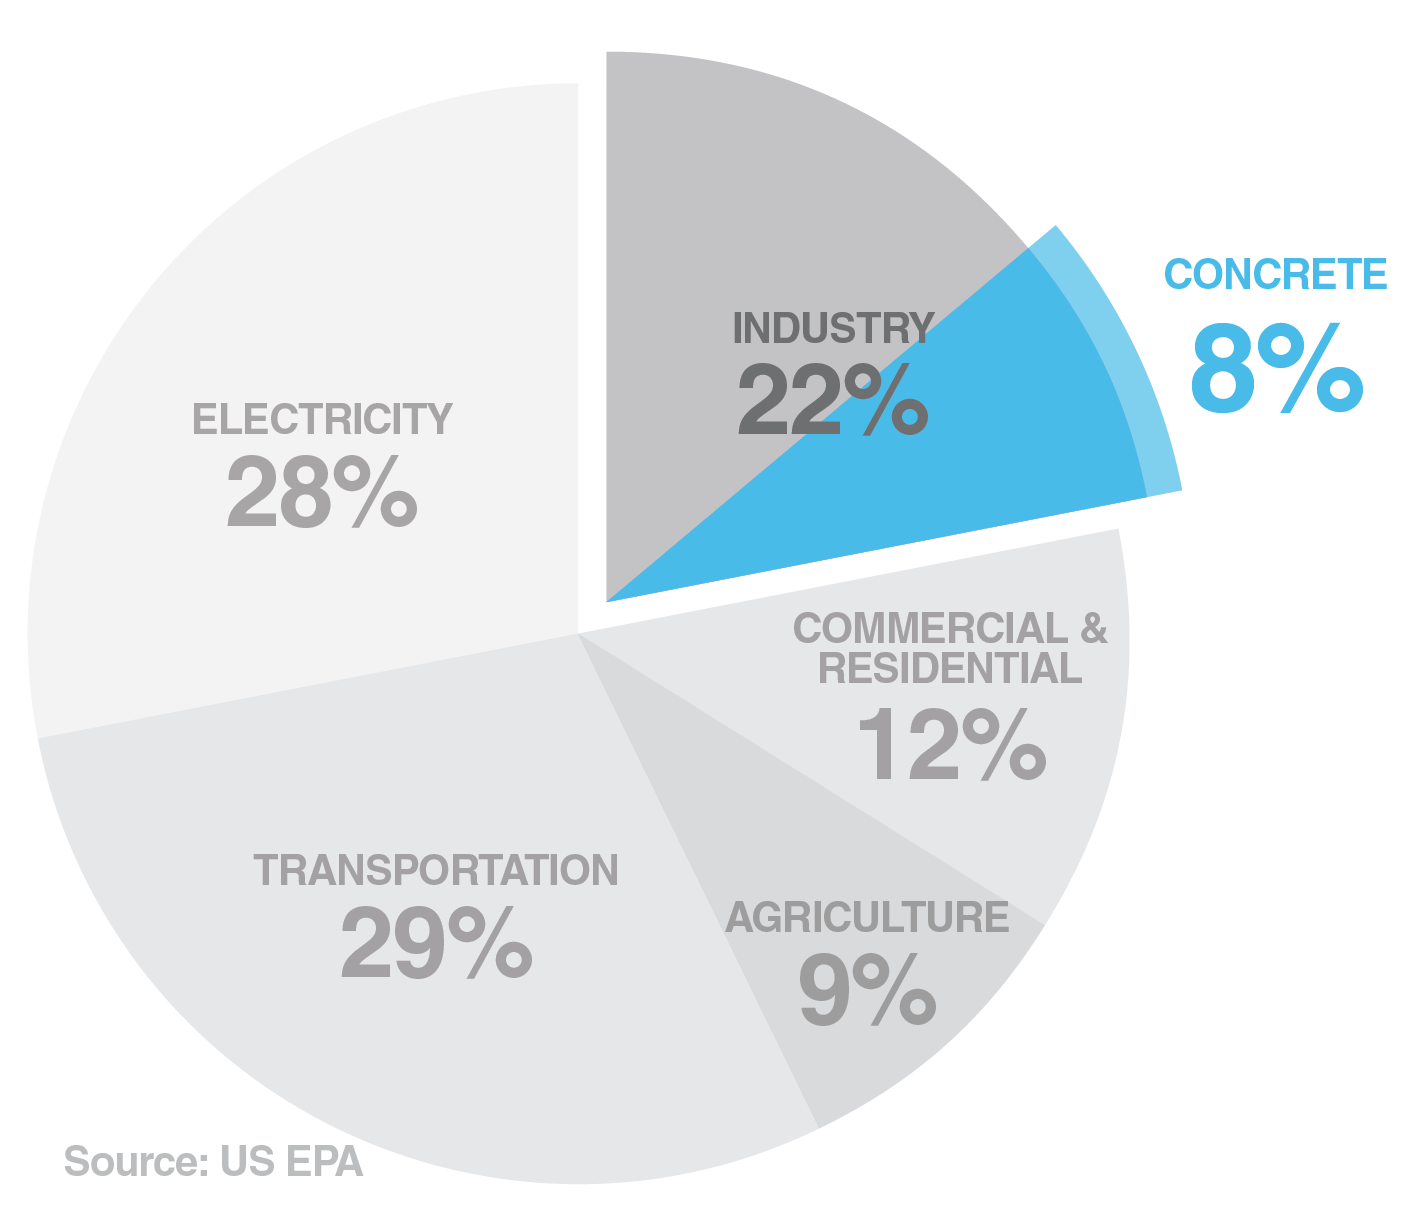
Concrete has a relatively simple recipe with only three fundamental ingredients: cement, water, and aggregates. Ordinary Portland cement (OPC) is most commonly used for making modern concrete and mortar. OPC is manufactured by heating crushed limestone up to 1,450°C, an energy-intensive process that produces a vast amount of GHG. Added to the GHG emitted from the immense fuel consumption, CO2 is a product of the reaction inside the kiln. Collectively, concrete is responsible for about 8% of the global CO2 emission, substantially contributing to climate change.
The Knowledge gaps
Knowing when the material sets is essential because concrete is only workable until it sets, and also because setting indicates when the material will start developing strength and stiffness. But it’s quite surprising that after 2000 years of using this material, we still don’t have concrete knowledge on why concrete has this induction period and the detailed mechanics and kinetics of the setting process. The main reason for this knowledge gap is because cementitious materials are so complex. And also, there are limitations in each characterization method. So the research question is around the complexity of cementitious materials and how to study them.
Concrete is a remarkably rich deposit of interesting and contemporary research questions, all contained in its ambiguities: granular or continuous?, liquid or solid?, crystalline or glassy?, smooth or rough?, “porous”, brittle or ductile?, material or process?
Van Damme
CCR (2018)
The quote above is from one of my favorite papers. My answer to these questions is that concrete is actually all of these and that concrete is a multiscale, heterogeneous, and changing material. And this is quantitatively and visually shown in my recent paper, which the images below are from. Langmuir
Data structure and dimension reduction methods
A Raman data is obtained using a fabricated stage that allows the in-situ Raman characteriation while the sample is curing underwater.
B The raw data set D is 2-dimensional data (n×ns), where n=nx×ny×nt is the number of the spectrum and ns (wavenumbers) is the spectral dimension. Similar to stack scan data, time-series scan data D can be batched into nt sub-data sets D according to the timestep, where nt corresponds to the number of timesteps. Each Dk contains the spectrum of nx×ny pixels and thus can be reshaped into a 3D array Dk'. The Raman spectrum of (xi,yj ) in Dk' is denoted as s(i,j,k)(ν), which is a vector with dimension ns. D' is a 4D array with nx×ny spatial dimensions, nt temporal dimensions, and ns spectral dimensions.
C Dimension Reduction 1: The average Raman spectra A are obtained by averaging the CCD counts of each wavenumber at every point
D Dimension Reduction 2: Basis analysis (BA; similar to PCA) is used to compute the basis spectra B and phase maps C.
E Dimension Reduction 3: Peak fitting analysis is performed to calculate and map the local chemical, mechanical, and crystallographic characteristics at each pixel. The position, width, and intensity of the peak at each pixel are calculated by fitting the peak profile with a Lorentzian function, which is typically used for fitting crystalline phases

Raman Basis Analysis
Raman basis analysis uses the concept of Principal Component Analysis (PCA) with the 1,024 spectral features. The following components were identified with thorough cleaning and analysis processes.

Cement hydration mapping
This figure shows one of the key results of the paper. The component distributions are shown with a heatmap, and the two-point correlation among the components are analyzed in order to quantify the hydration kinetics.
